Macy's 2008 Annual Report Download - page 104
Download and view the complete annual report
Please find page 104 of the 2008 Macy's annual report below. You can navigate through the pages in the report by either clicking on the pages listed below, or by using the keyword search tool below to find specific information within the annual report.-
 1
1 -
2
-
3
-
4
-
5
-
6
-
7
-
8
-
9
-
10
-
11
-
12
-
13
-
14
-
15
-
16
-
17
-
18
-
19
-
20
-
21
-
22
-
23
-
24
-
25
-
26
-
27
-
28
-
29
-
30
-
31
-
32
-
33
-
34
-
35
-
36
-
37
-
38
-
39
-
40
-
41
-
42
-
43
-
44
-
45
-
46
-
47
-
48
-
49
-
50
-
51
-
52
-
53
-
54
-
55
-
56
-
57
-
58
-
59
-
60
-
61
-
62
-
63
-
64
-
65
-
66
-
67
-
68
-
69
-
70
-
71
-
72
-
73
-
74
-
75
-
76
-
77
-
78
-
79
-
80
-
81
-
82
-
83
-
84
-
85
-
86
-
87
-
88
-
89
-
90
-
91
-
92
-
93
-
 94
94 -
 95
95 -
 96
96 -
 97
97 -
 98
98 -
 99
99 -
 100
100 -
 101
101 -
 102
102 -
 103
103 -
 104
104 -
 105
105 -
 106
106 -
 107
107 -
 108
108 -
 109
109
 |
 |

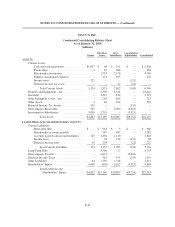
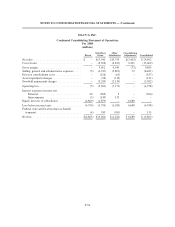
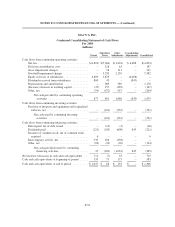
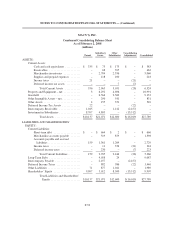
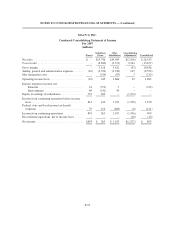
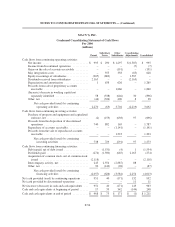
NOTES TO CONSOLIDATED FINANCIAL STATEMENTS — (Continued)
MACY’S, INC.
Condensed Consolidating Statement of Cash Flows
For 2006
(millions)
Parent
Subsidiary
Issuer
Other
Subsidiaries
Consolidating
Adjustments Consolidated
Cash flows from continuing operating activities:
Net income ................................ $ 995 $ 290 $1,297 $(1,587) $ 995
Income from discontinued operations ........... – – – (7) (7)
Gains on the sale of accounts receivable ......... – – (191) – (191)
May integrations costs ....................... – 355 358 (85) 628
Equity in earnings of subsidiaries ............... (905) (682) – 1,587 –
Dividends received from subsidiaries ........... 2,165 – – (2,165) –
Depreciation and amortization ................. 1 638 626 – 1,265
Proceeds from sale of proprietary accounts
receivable ............................... – – 1,860 – 1,860
(Increase) decrease in working capital not
separately identified ....................... 58 (338) (646) 30 (896)
Other, net ................................. (44) (326) 400 8 38
Net cash provided (used) by continuing
operating activities .................... 2,270 (63) 3,704 (2,219) 3,692
Cash flows from continuing investing activities:
Purchase of property and equipment and capitalized
software, net ............................. (2) (153) (638) 97 (696)
Proceeds from the disposition of discontinued
operations ............................... 740 882 165 – 1,787
Repurchase of accounts receivable .............. – – (1,141) – (1,141)
Proceeds from the sale of repurchased accounts
receivable ............................... – – 1,323 – 1,323
Net cash provided (used) by continuing
investing activities .................... 738 729 (291) 97 1,273
Cash flows from continuing financing activities:
Debt repaid, net of debt issued ................. – (1,531) (4) 1 (1,534)
Dividends paid ............................. (274) (1,500) (665) 2,165 (274)
Acquisition of common stock, net of common stock
issued .................................. (2,118) – – – (2,118)
Intercompany activity, net .................... 245 2,554 (2,887) 88 –
Other, net ................................. 90 (149) (28) – (87)
Net cash provided (used) by continuing
financing activities .................... (2,057) (626) (3,584) 2,254 (4,013)
Net cash provided (used) by continuing operations ..... 951 40 (171) 132 952
Net cash provided by discontinued operations ......... – – – 11 11
Net increase (decrease) in cash and cash equivalents . . . 951 40 (171) 143 963
Cash and cash equivalents at beginning of period ...... 17 33 342 (144) 248
Cash and cash equivalents at end of period ........... $ 968 $ 73 $ 171 $ (1) $1,211
F-56