Macy's 2008 Annual Report Download - page 94
Download and view the complete annual report
Please find page 94 of the 2008 Macy's annual report below. You can navigate through the pages in the report by either clicking on the pages listed below, or by using the keyword search tool below to find specific information within the annual report.-
 1
1 -
2
-
3
-
4
-
5
-
6
-
7
-
8
-
9
-
10
-
11
-
12
-
13
-
14
-
15
-
16
-
17
-
18
-
19
-
20
-
21
-
22
-
23
-
24
-
25
-
26
-
27
-
28
-
29
-
30
-
31
-
32
-
33
-
34
-
35
-
36
-
37
-
38
-
39
-
40
-
41
-
42
-
43
-
44
-
45
-
46
-
47
-
48
-
49
-
50
-
51
-
52
-
53
-
54
-
55
-
56
-
57
-
58
-
59
-
60
-
61
-
62
-
63
-
64
-
65
-
66
-
67
-
68
-
69
-
70
-
71
-
72
-
73
-
74
-
75
-
76
-
77
-
78
-
79
-
80
-
81
-
82
-
83
-
 84
84 -
 85
85 -
 86
86 -
 87
87 -
 88
88 -
 89
89 -
 90
90 -
 91
91 -
 92
92 -
 93
93 -
 94
94 -
 95
95 -
 96
96 -
 97
97 -
 98
98 -
 99
99 -
 100
100 -
 101
101 -
 102
102 -
 103
103 -
 104
104 -
105
-
106
-
107
-
108
-
109
 |
 |

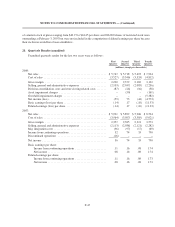
NOTES TO CONSOLIDATED FINANCIAL STATEMENTS — (Continued)
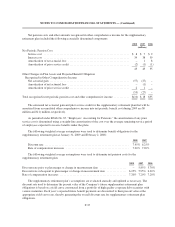
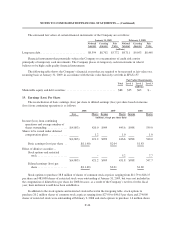
The estimated fair values of certain financial instruments of the Company are as follows:
January 31, 2009 February 2, 2008
Notional
Amount
Carrying
Amount
Fair
Value
Notional
Amount
Carrying
Amount
Fair
Value
(millions)
Long-term debt ............................... $8,394 $8,702 $5,772 $8,711 $9,053 $8,448
Financial instruments that potentially subject the Company to concentrations of credit risk consist
principally of temporary cash investments. The Company places its temporary cash investments in what it
believes to be high credit quality financial instruments.
The following table shows the Company’s financial assets that are required to be measured at fair value on a
recurring basis at January 31, 2009, in accordance with the fair value hierarchy set forth in SFAS 157:
Total
Fair Value Measurements
Level 1 Level 2 Level 3
(millions)
Marketable equity and debt securities .................................. $88 $25 $63 $–
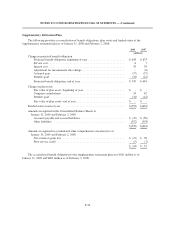
19. Earnings (Loss) Per Share
The reconciliation of basic earnings (loss) per share to diluted earnings (loss) per share based on income
(loss) from continuing operations is as follows:
2008 2007 2006
Loss Shares Income Shares Income Shares
(millions, except per share data)
Income (loss) from continuing
operations and average number of
shares outstanding .............. $(4,803) 420.0 $909 445.6 $988 539.0
Shares to be issued under deferred
compensation plans ............. 1.2 1.0 1.0
$(4,803) 421.2 $909 446.6 $988 540.0
Basic earnings (loss) per share . . $(11.40) $2.04 $1.83
Effect of dilutive securities –
Stock options and restricted
stock ..................... – 5.2 7.7
$(4,803) 421.2 $909 451.8 $988 547.7
Diluted earnings (loss) per
share ..................... $(11.40) $2.01 $1.80
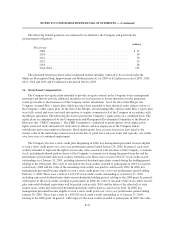
Stock options to purchase 38.8 million of shares of common stock at prices ranging from $12.79 to $46.15
per share and 483,000 shares of restricted stock were outstanding at January 31, 2009, but were not included in
the computation of diluted loss per share for 2008 because, as a result of the Company’s net loss for the fiscal
year, their inclusion would have been antidilutive.
In addition to the stock options and restricted stock reflected in the foregoing table, stock options to
purchase 20.2 million shares of common stock at prices ranging from $27.00 to $46.15 per share and 274,000
shares of restricted stock were outstanding at February 2, 2008 and stock options to purchase 1.4 million shares
F-46