Lumber Liquidators 2008 Annual Report Download - page 56
Download and view the complete annual report
Please find page 56 of the 2008 Lumber Liquidators annual report below. You can navigate through the pages in the report by either clicking on the pages listed below, or by using the keyword search tool below to find specific information within the annual report.-
 1
1 -
2
-
3
-
4
-
5
-
6
-
7
-
8
-
9
-
10
-
11
-
12
-
13
-
14
-
15
-
16
-
17
-
18
-
19
-
20
-
21
-
22
-
23
-
24
-
25
-
26
-
27
-
28
-
29
-
30
-
31
-
32
-
33
-
34
-
35
-
36
-
37
-
38
-
39
-
40
-
41
-
42
-
43
-
44
-
45
-
 46
46 -
 47
47 -
 48
48 -
 49
49 -
 50
50 -
 51
51 -
 52
52 -
 53
53 -
 54
54 -
 55
55 -
 56
56 -
 57
57 -
 58
58 -
 59
59 -
 60
60 -
 61
61 -
 62
62 -
 63
63 -
 64
64 -
 65
65 -
 66
66 -
67
-
68
-
69
-
70
-
71
-
72
-
73
-
74
-
75
-
76
-
77
-
78
-
79
-
80
 |
 |

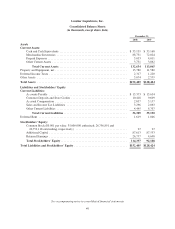
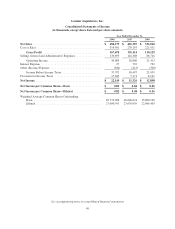
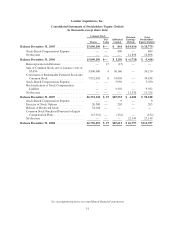
Lumber Liquidators, Inc.
Consolidated Statements of Income
(in thousands, except share data and per share amounts)
Year Ended December 31,
2008 2007 2006
Net Sales ............................................... $ 482,179 $ 405,307 $ 332,060
Cost of Sales ............................................ 314,501 270,193 221,931
Gross Profit ........................................ 167,678 135,114 110,129
Selling, General and Administrative Expenses .................. 130,693 116,308 88,716
Operating Income .................................... 36,985 18,806 21,413
Interest Expense ......................................... 27 722 722
Other (Income) Expense ................................... (834) (413) (368)
Income Before Income Taxes ........................... 37,792 18,497 21,059
Provision for Income Taxes ................................ 15,643 7,171 8,161
Net Income ............................................. $ 22,149 $ 11,326 $ 12,898
Net Income per Common Share—Basic ..................... $ 0.83 $ 0.68 $ 0.86
Net Income per Common Share—Diluted ................... $ 0.82 $ 0.48 $ 0.56
Weighted Average Common Shares Outstanding:
Basic .............................................. 26,772,288 16,646,674 15,000,100
Diluted ............................................. 27,090,593 23,634,995 22,989,403
See accompanying notes to consolidated financial statements
50