Lumber Liquidators 2008 Annual Report Download - page 36
Download and view the complete annual report
Please find page 36 of the 2008 Lumber Liquidators annual report below. You can navigate through the pages in the report by either clicking on the pages listed below, or by using the keyword search tool below to find specific information within the annual report.-
 1
1 -
2
-
3
-
4
-
5
-
6
-
7
-
8
-
9
-
10
-
11
-
12
-
13
-
14
-
15
-
16
-
17
-
18
-
19
-
20
-
21
-
22
-
23
-
24
-
25
-
 26
26 -
 27
27 -
 28
28 -
 29
29 -
 30
30 -
 31
31 -
 32
32 -
 33
33 -
 34
34 -
 35
35 -
 36
36 -
 37
37 -
 38
38 -
 39
39 -
 40
40 -
 41
41 -
 42
42 -
 43
43 -
 44
44 -
 45
45 -
 46
46 -
47
-
48
-
49
-
50
-
51
-
52
-
53
-
54
-
55
-
56
-
57
-
58
-
59
-
60
-
61
-
62
-
63
-
64
-
65
-
66
-
67
-
68
-
69
-
70
-
71
-
72
-
73
-
74
-
75
-
76
-
77
-
78
-
79
-
80
 |
 |
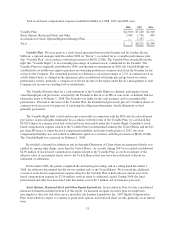
External Factors Impacting Our Business
The wood flooring market which serves the homeowner is highly fragmented and dependent on a number of
complex economic and demographic factors that impact home-related discretionary spending, and these factors
may vary locally, regionally, and nationally. We are impacted by home remodeling activity, employment levels,
housing turnover, real estate prices, new housing starts, consumer confidence, credit availability, and the general
health of consumer discretionary spending. Many of the economic indicators associated with the wood flooring
market and generally associated with consumer discretionary spending were weak in 2007 and weakened further
in 2008, particularly in the quarter ended December 31, 2008. We will continue to monitor demand indicators for
our segment of the flooring market, but we currently do not anticipate significant improvement in the general
wood flooring market in 2009.
Although the hardwood flooring market is projected to experience long-term growth, industry sources report
an overall decline in the demand for flooring from 2006 through 2008. We believe the number of retailers
serving the homeowner-based segment of the wood floor market declined in both 2007 and 2008, and our results
benefited from increased market share. Though we are likely to be adversely impacted by decreased consumer
demand for wood flooring, we believe we will continue to benefit from the additional market share, gained
primarily through new store openings. In addition, we continue to believe that the longer term trends for our
industry are favorable, including customer perception of hardwood flooring as an attractive alternative to other
floor coverings, home improvement spending, home ownership, increasing home size and demographic trends.
See “Item 1A. Risk Factors—Risks Related to Our Business and Industry.”
Assessing the Performance of Our Business
In assessing the performance of our business, we consider a variety of performance and financial measures.
The key measures we use to determine how our business is performing are net sales and comparable store net
sales. Some of the operational metrics that we consider in evaluating net sales include our sales mix, future
demand as measured by open orders and the related customer deposits, the average number of days an order/
customer deposit is outstanding, requests for samples and catalogs, new store performance levels and our new
store pipeline. In assessing the overall performance of our business, we also consider gross profit and selling,
general and administrative expenses.
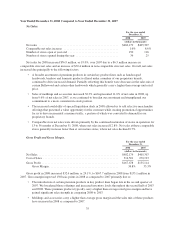
Net Sales. We derive net sales primarily from sales of solid and engineered hardwoods, laminate, bamboo
and cork flooring products, moldings and flooring accessories made through our stores, call center, website and
catalogs. Net sales, which include freight costs billed to customers, are net of any returns by customers. Net sales
from customer orders placed through the call center, our website or our catalogs are recorded by the store where
the customer picks up the merchandise or schedules delivery. Several factors affect our net sales in any period,
including the number of stores in operation and comparable store net sales for any given store or group of stores,
which can be influenced by our operational effectiveness, pricing, marketing and promotional efforts, brand
recognition levels, local competition and trade area demographics.
Growth In Our Store Base. We opened 34 stores in 2008, 25 stores in 2007, and 16 stores in 2006, which
contributed substantially to the growth of our net sales in those years. We plan to open between 30 and 40 new
stores during each of the next several years. The cost required to open a typical new store is generally less than
$280,000, of which inventory, net of trade payables, represents approximately $230,000. Our new stores have
historically opened with an initial ramp-up period typically lasting from 36 to 48 months or more, during which
they have generated net sales below the levels at which we expect them to normalize. Our average new store
across our markets has, however, historically become profitable within three months of beginning operations and
generally returned its initial cash investment within eight months. See “Item 1A. Risk Factors—Risks Related to
Our Business and Industry.”
30