Lumber Liquidators 2008 Annual Report Download - page 37
Download and view the complete annual report
Please find page 37 of the 2008 Lumber Liquidators annual report below. You can navigate through the pages in the report by either clicking on the pages listed below, or by using the keyword search tool below to find specific information within the annual report.-
 1
1 -
2
-
3
-
4
-
5
-
6
-
7
-
8
-
9
-
10
-
11
-
12
-
13
-
14
-
15
-
16
-
17
-
18
-
19
-
20
-
21
-
22
-
23
-
24
-
25
-
26
-
 27
27 -
 28
28 -
 29
29 -
 30
30 -
 31
31 -
 32
32 -
 33
33 -
 34
34 -
 35
35 -
 36
36 -
 37
37 -
 38
38 -
 39
39 -
 40
40 -
 41
41 -
 42
42 -
 43
43 -
 44
44 -
 45
45 -
 46
46 -
 47
47 -
48
-
49
-
50
-
51
-
52
-
53
-
54
-
55
-
56
-
57
-
58
-
59
-
60
-
61
-
62
-
63
-
64
-
65
-
66
-
67
-
68
-
69
-
70
-
71
-
72
-
73
-
74
-
75
-
76
-
77
-
78
-
79
-
80
 |
 |
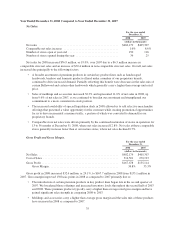
Comparable Store Net Sales. The other important driver of growth in our net sales has been increased
comparable store net sales, which have accounted for a substantial portion of our historical net sales growth.
Stores generally enter the comparable store base on the first day of the thirteenth full calendar month after they
open. Various factors affect comparable store net sales, including:
• consumer preferences, buying trends and overall economic trends and our ability to anticipate and
respond effectively to changes therein;
• changes in product assortment and the overall sales mix;
• the number of stores we open in existing markets;
• the maturity of a comparable store;
• competition;
• pricing;
• product availability and quality;
• the timing of our advertising promotional events and/or timing of three-day Holiday weekends; and
• weather and other climatological effects.
We believe that future comparable store net sales will likely increase at rates slower than those achieved
over the past several years, due to increases in baseline store volumes and an increase in the number of new
stores opened in existing markets, which tend to open at a higher base level of net sales. See “Item 1A. Risk
Factors—Risks Related to Our Business and Industry.”
Gross Profit and Gross Margin. Gross profit is equal to our net sales minus our cost of sales, and gross
margin is equal to gross profit as a percentage of net sales. Our gross profit has historically been affected by,
among other things:
• our sales volumes and the margins on products we sell;
• the mix of our products sold and the related cost of that merchandise, including in particular the cost of
hardwood and other flooring products and accessories;
• transportation costs, both from our suppliers to our distribution center or stores and from our
distribution center to our stores, which may vary with factors such as fuel costs;
• customs and duty charges on international purchases;
• the cost of third-party carrier services providing customer deliveries;
• in-house finishing costs, particularly for our Bellawood brand;
• the costs of providing samples requested by our customers;
• inventory adjustments, including shrinkage;
• the extent of any retail price reductions and the volume of inventory impacted by sales and promotional
events; and
• competition.
We try to minimize the volatility of hardwood prices—which represents the largest portion of our cost of
sales—by relying on our close relationships with our suppliers and utilizing our financial flexibility to establish
beneficial payment terms. Generally, we strive to match merchandise purchase lead times with anticipated
demand to maximize sustainable gross margins, and those lead times currently range by product from
approximately 90 to 180 days.
31