Lumber Liquidators 2008 Annual Report Download - page 42
Download and view the complete annual report
Please find page 42 of the 2008 Lumber Liquidators annual report below. You can navigate through the pages in the report by either clicking on the pages listed below, or by using the keyword search tool below to find specific information within the annual report.-
 1
1 -
2
-
3
-
4
-
5
-
6
-
7
-
8
-
9
-
10
-
11
-
12
-
13
-
14
-
15
-
16
-
17
-
18
-
19
-
20
-
21
-
22
-
23
-
24
-
25
-
26
-
27
-
28
-
29
-
30
-
31
-
 32
32 -
 33
33 -
 34
34 -
 35
35 -
 36
36 -
 37
37 -
 38
38 -
 39
39 -
 40
40 -
 41
41 -
 42
42 -
 43
43 -
 44
44 -
 45
45 -
 46
46 -
 47
47 -
 48
48 -
 49
49 -
 50
50 -
 51
51 -
 52
52 -
53
-
54
-
55
-
56
-
57
-
58
-
59
-
60
-
61
-
62
-
63
-
64
-
65
-
66
-
67
-
68
-
69
-
70
-
71
-
72
-
73
-
74
-
75
-
76
-
77
-
78
-
79
-
80
 |
 |

• Expenses related to domestic and international transportation generally increased in comparing 2008 to
2007. Rising fuel costs generally increased the average cost of an inbound international container and
the average per-mile ground charge. These fuel costs which had significantly risen in 2008, declined
sharply in the fourth quarter. As a component of the product unit cost, however, the gross margin
impact of a change in fuel costs tends to lag by 60 to 120 days. In addition, a number of logistics
initiatives have been implemented to reduce the miles driven by trucks supplying merchandise
inventories to our stores. These initiatives began in the third and fourth quarter of 2007 and continued
throughout 2008.
• Liquidation deals favorably impacted 2008 gross margin in three ways:
• In the second quarter of 2008, we strengthened our merchandising staff to enhance our focus on
the entire product cycle of liquidation deals, an important component of both our product
assortment and our promotional marketing campaigns.
• Certain special higher than average quality and unit count liquidation deals were available
throughout 2008, but particularly in the first and second quarters. We estimate that these special
buys, which are difficult to anticipate in future periods, benefited gross margin by approximately
10 to 15 basis points in comparing 2008 to the prior year.
• The promotional opportunities surrounding these special liquidation deals generated incremental
consumer traffic, a certain portion of which we believe converted to our proprietary products,
particularly our laminates, contributing up to approximately 7 to 8 basis points to the
improvement in our gross margin for the year.
• A tariff on certain bamboo products was reduced in the second quarter of 2008. The tariff was
originally implemented in the second quarter of 2007 and was rebated retroactively on an individual
entry basis. Gross margin for 2008 benefited from the retroactive rebate by approximately 20 basis
points. We completed the rebate process in the third quarter of 2008.
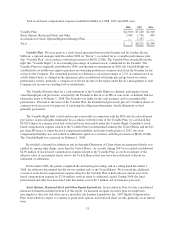
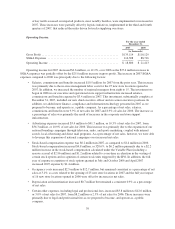
Operating Income.
For the year ended
December 31,
2008 2007
(in thousands)
Gross Profit .................................................... $167,678 $135,114
SG&A Expenses ................................................ 130,693 116,308
Operating Income ............................................... $ 36,985 $ 18,806
Operating income for 2008 increased $18.2 million, or 96.7%, over 2007 as the $32.6 million increase in
gross profit was partially offset by a $14.4 million increase in SG&A expenses. These increases in SG&A
expenses were principally due to the following factors:
• Salaries, commissions and benefits increased $8.6 million for 2008 from the prior year. This increase
was primarily due to the growth in our store base and related warehouse operations, but also reflect
salaries, commissions and benefits related to our executive and operational infrastructure investment,
which we completed in the first quarter of 2008. As a percentage of net sales, salaries, commissions
and benefits were 10.1% of net sales for 2008 and 9.9% of net sales for 2007. This increase as a
percentage of net sales was primarily the result of increases in employee benefit costs and additional
corporate store support infrastructure.
• Advertising expenses increased $4.1 million to $45.8 million, or 9.5% of net sales for 2008, from $41.7
million, or 10.3% of net sales for 2007. As a percentage of net sales, our national advertising
campaigns were leveraged across a larger store base in comparing 2008 to 2007. This leverage was
partially offset by an increase in the advertising spend for direct sales generation and local advertising
36