Lumber Liquidators 2008 Annual Report Download - page 31
Download and view the complete annual report
Please find page 31 of the 2008 Lumber Liquidators annual report below. You can navigate through the pages in the report by either clicking on the pages listed below, or by using the keyword search tool below to find specific information within the annual report.-
 1
1 -
2
-
3
-
4
-
5
-
6
-
7
-
8
-
9
-
10
-
11
-
12
-
13
-
14
-
15
-
16
-
17
-
18
-
19
-
20
-
 21
21 -
 22
22 -
 23
23 -
 24
24 -
 25
25 -
 26
26 -
 27
27 -
 28
28 -
 29
29 -
 30
30 -
 31
31 -
 32
32 -
 33
33 -
 34
34 -
 35
35 -
 36
36 -
 37
37 -
 38
38 -
 39
39 -
 40
40 -
 41
41 -
42
-
43
-
44
-
45
-
46
-
47
-
48
-
49
-
50
-
51
-
52
-
53
-
54
-
55
-
56
-
57
-
58
-
59
-
60
-
61
-
62
-
63
-
64
-
65
-
66
-
67
-
68
-
69
-
70
-
71
-
72
-
73
-
74
-
75
-
76
-
77
-
78
-
79
-
80
 |
 |
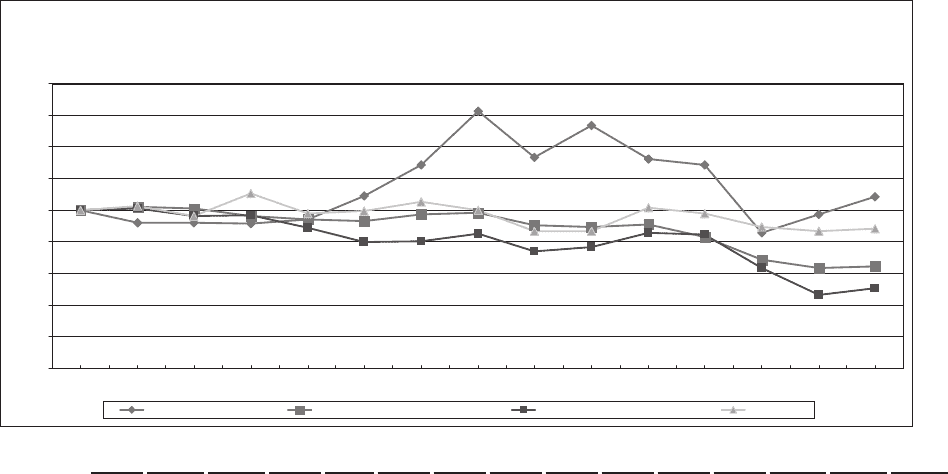
Performance Graph
The following performance graph compares the performance of our common stock during the period beginning
November 9, 2007 and ending December 31, 2008 to the Dow Jones US Furnishings Index and a Peer Group index
consisting of companies selected for the same period. Home Depot, Inc. and Lowe’s, Inc. constitute the Peer Group index
companies. The graph assumes a $100 investment in our common stock and in each of the indexes at the beginning of the
period, and a reinvestment of dividends paid on such investments throughout the period.
Comparison of 1 Year Cumulative Total Return
Assumes Initial Investment of $100
December 2008
0.00
20.00
40.00
60.00
80.00
100.00
120.00
140.00
160.00
180.00
11/9/2007 11/30/2007 12/31/2007 1/31/2008 2/29/2008 3/31/2008 4/30/2008 5/31/2008 6/30/2008 7/31/2008 8/31/2008 9/30/2008 10/31/2008 11/30/2008 12/31/2008
Lumber Liquidators, Inc. NYSE Stock Market (US Companies) Dow Jones US Furnishings Index Peer Group
11/9/07 11/30/07 12/31/07 1/31/08 2/29/08 3/31/08 4/30/08 5/31/08 6/30/08 7/31/08 8/31/08 9/30/08 10/31/08 11/30/08 12/31/08
Lumber
Liquidators,
Inc. ..........$100.00 $ 91.91 $ 92.11 $ 91.19 $93.75 $108.61 $128.48 $162.70 $133.20 $153.48 $132.27 $128.69 $85.35 $97.13 $108.19
NYSE Stock
Market (US
Companies) . . . $100.00 $101.74 $101.00 $ 96.09 $93.81 $ 92.78 $ 97.07 $ 98.42 $ 90.39 $ 89.30 $ 90.65 $ 82.70 $68.43 $63.33 $ 64.48
Dow Jones US
Furnishings
Index ........$100.00 $100.91 $ 96.23 $ 96.62 $88.44 $ 79.59 $ 80.23 $ 84.93 $ 74.00 $ 76.58 $ 85.72 $ 84.51 $62.98 $46.15 $ 50.20
Peer Group ......$100.00 $102.39 $ 95.85 $110.45 $97.62 $ 99.23 $105.14 $100.00 $ 86.39 $ 86.64 $101.34 $ 97.51 $89.22 $86.30 $ 88.21
This stock performance information is “furnished” and shall not be deemed to be “soliciting material” or subject to
Rule 14A, shall not be deemed “filed” for purposes of Section 18 of the Exchange Act or otherwise subject to the
liabilities of that section, and shall not be deemed incorporated by reference in any filing under the Securities Act of 1933,
as amended, or the Exchange Act, whether made before or after the date of this report and irrespective of any general
incorporation by reference language in any such filing, except to the extent that we specifically incorporate the
information by reference.
25