Lumber Liquidators 2008 Annual Report Download - page 34
Download and view the complete annual report
Please find page 34 of the 2008 Lumber Liquidators annual report below. You can navigate through the pages in the report by either clicking on the pages listed below, or by using the keyword search tool below to find specific information within the annual report.-
 1
1 -
2
-
3
-
4
-
5
-
6
-
7
-
8
-
9
-
10
-
11
-
12
-
13
-
14
-
15
-
16
-
17
-
18
-
19
-
20
-
21
-
22
-
23
-
 24
24 -
 25
25 -
 26
26 -
 27
27 -
 28
28 -
 29
29 -
 30
30 -
 31
31 -
 32
32 -
 33
33 -
 34
34 -
 35
35 -
 36
36 -
 37
37 -
 38
38 -
 39
39 -
 40
40 -
 41
41 -
 42
42 -
 43
43 -
 44
44 -
45
-
46
-
47
-
48
-
49
-
50
-
51
-
52
-
53
-
54
-
55
-
56
-
57
-
58
-
59
-
60
-
61
-
62
-
63
-
64
-
65
-
66
-
67
-
68
-
69
-
70
-
71
-
72
-
73
-
74
-
75
-
76
-
77
-
78
-
79
-
80
 |
 |

We have grown our store base rapidly with 50% of our total store locations opened in the past three years,
including 34 new stores in 2008. Historically, we established a national footprint primarily by opening one store
in primary and secondary metropolitan markets, and in late 2005, we began opening complementary stores in
these existing markets. We believe our primary and secondary metropolitan markets will benefit from additional
store locations. Of the 30 to 40 stores we plan to open during each of the next several years, we expect an
approximately equal mix of stores in these existing markets and stores in new markets. Our experience has
shown that our store model is well suited for markets smaller than the primary and secondary metropolitan areas,
and going forward, these will represent the majority of our new market stores.
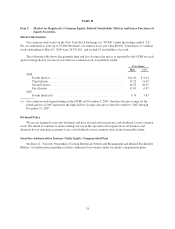
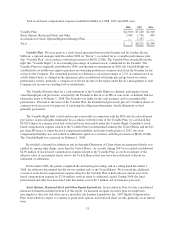
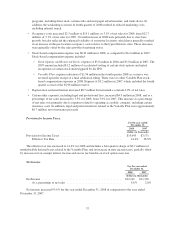
Our recent store opening activity is as follows:
2008 2007 2006
Number of stores at January 1 ................................................ 116 91 76
New stores ........................................................... 34 25 16
Closed stores(1) ....................................................... — — (1)
Number of stores at December 31 ........................................... 150 116 91
(1) The 2006 closed location represents a laminate flooring-only store established to operate during the
remaining lease period of a relocated store.
Besides new store openings, the other important driver of growth in our net sales has been increased
comparable store net sales, which accounted for a substantial portion of our historical net sales growth. We
generally consider a store comparable on the first day of the 13th month of operation, and stores in operation from
13 months to 36 months have historically shown greater net sales increases than our more mature stores. Our
comparable store net sales increases were 1.6% in 2008, 8.6% in 2007 and 17.3% in 2006. Due to increases in
baseline store volumes, an increase in the number of new stores opened in existing markets, and a weakening in
the residential flooring market, we anticipated comparable store net sales to increase at slower rates in 2008 than
in previous years. Through the nine months ended September 30, 2008, comparable store net sales had increased
3.8%. In the quarter ended December 31, 2008, however, our comparable store net sales declined 4.6% due to a
dramatic decline in the macroeconomic environment.
We expect home-related discretionary spending will continue to be challenged by the macroeconomic
environment throughout 2009. Although the hardwood flooring market is likely to remain weak as a result, we
believe the number of retailers serving the homeowner-based segment of the wood floor market will continue to
decline and present an opportunity for market share growth, primarily through store base growth. We do not
anticipate comparable store sales growth until the latter half of 2009, but we intend to continue our strategic new
store opening plan with 30 to 36 new locations in 2009. We believe we will continue to expand our operating
margins as we maintain focus on our value proposition to the customer and concentrate on product flow
initiatives and efficiencies from consistent store operations.
Our gross profit is driven primarily by the cost of acquiring the products we sell from our suppliers, but also
includes inbound transportation costs from those suppliers to our distribution center or stores, customs and duty
charges, transportation charges from our distribution center to our stores and the cost of delivering product
purchases to the customer. We have focused our efforts on expanding our product assortment, strengthening our
in-stock position and implementing logistics initiatives to reduce transportation costs, which resulted in gradual
gross margin expansion that began in the latter half of 2007.
Historically, our most significant operating expenses have been our advertising expenses and labor costs.
Our annual advertising costs have generally declined as a percentage of net sales as we have increased our store
base, but may vary from quarter to quarter with shifts in marketing strategy and the timing of our marketing
campaigns. Our in-store labor costs will increase as a result of new store openings, and in general, we expect
28