Lumber Liquidators 2008 Annual Report Download - page 40
Download and view the complete annual report
Please find page 40 of the 2008 Lumber Liquidators annual report below. You can navigate through the pages in the report by either clicking on the pages listed below, or by using the keyword search tool below to find specific information within the annual report.-
 1
1 -
2
-
3
-
4
-
5
-
6
-
7
-
8
-
9
-
10
-
11
-
12
-
13
-
14
-
15
-
16
-
17
-
18
-
19
-
20
-
21
-
22
-
23
-
24
-
25
-
26
-
27
-
28
-
29
-
 30
30 -
 31
31 -
 32
32 -
 33
33 -
 34
34 -
 35
35 -
 36
36 -
 37
37 -
 38
38 -
 39
39 -
 40
40 -
 41
41 -
 42
42 -
 43
43 -
 44
44 -
 45
45 -
 46
46 -
 47
47 -
 48
48 -
 49
49 -
 50
50 -
51
-
52
-
53
-
54
-
55
-
56
-
57
-
58
-
59
-
60
-
61
-
62
-
63
-
64
-
65
-
66
-
67
-
68
-
69
-
70
-
71
-
72
-
73
-
74
-
75
-
76
-
77
-
78
-
79
-
80
 |
 |

Our initial grant of stock options was in 2006. This initial grant of 1,796,847 stock options represents 80.7%
of the stock options outstanding at December 31, 2008, and will now generally vest through July 2009 (1,031,847
options) and October 2010 (865,000 options).
Acceleration of Stock Options and Initial Recognition of Stock Units. We recorded approximately $1.0
million of stock-based compensation expense in the fourth quarter of 2007 related to the one-time acceleration,
triggered by the IPO, of vesting provisions in certain stock option agreements resulting in the immediate vesting
of 261,313 stock options. In addition, we recorded approximately $0.2 million of stock-based compensation
expense in the fourth quarter of 2007 related to the initial recognition of stock units under the 2006 Regional Plan
(as defined in Note 6 to the consolidated financial statements).
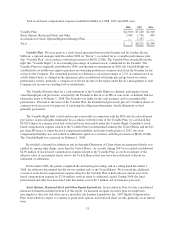
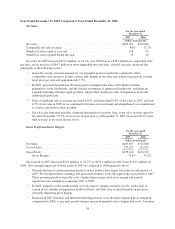
Results of Operations
The following tables set forth components of our results of operations for the periods indicated, both in
dollars and as a percentage of net sales.
Year Ended December 31,
2008 2007 2006
(in millions, except percentages and
number of stores)
Net sales ....................................................... $482.2 $405.3 $332.1
Comparable store net sales increase from prior year ................ 1.6% 8.6% 17.3%
Number of stores opened in period(1) ............................ 34 25 16
Cost of sales .................................................... $314.5 $270.2 $221.9
Gross profit ..................................................... 167.7 135.1 110.1
SG&A expenses ................................................. 130.7 116.3 88.7
Operating income ................................................ 37.0 18.8 21.4
Net income ..................................................... 22.1 11.3 12.9
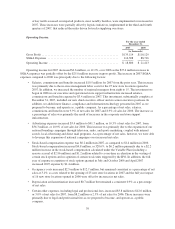
Year Ended December 31,
2008 2007 2006
(% of net sales)
Net sales ....................................................... 100.0% 100.0% 100.0%
Cost of sales .................................................... 65.2% 66.7% 66.8%
Gross profit ..................................................... 34.8% 33.3% 33.2%
SG&A expenses ................................................. 27.1% 28.7% 26.7%
Operating income ................................................ 7.7% 4.6% 6.4%
Net income ..................................................... 4.6% 2.8% 3.9%
(1) In May 2006, we closed a laminate flooring-only store that had been established to operate during the
remaining lease period of a relocated store.
34