Lumber Liquidators 2008 Annual Report Download - page 41
Download and view the complete annual report
Please find page 41 of the 2008 Lumber Liquidators annual report below. You can navigate through the pages in the report by either clicking on the pages listed below, or by using the keyword search tool below to find specific information within the annual report.-
 1
1 -
2
-
3
-
4
-
5
-
6
-
7
-
8
-
9
-
10
-
11
-
12
-
13
-
14
-
15
-
16
-
17
-
18
-
19
-
20
-
21
-
22
-
23
-
24
-
25
-
26
-
27
-
28
-
29
-
30
-
 31
31 -
 32
32 -
 33
33 -
 34
34 -
 35
35 -
 36
36 -
 37
37 -
 38
38 -
 39
39 -
 40
40 -
 41
41 -
 42
42 -
 43
43 -
 44
44 -
 45
45 -
 46
46 -
 47
47 -
 48
48 -
 49
49 -
 50
50 -
 51
51 -
52
-
53
-
54
-
55
-
56
-
57
-
58
-
59
-
60
-
61
-
62
-
63
-
64
-
65
-
66
-
67
-
68
-
69
-
70
-
71
-
72
-
73
-
74
-
75
-
76
-
77
-
78
-
79
-
80
 |
 |

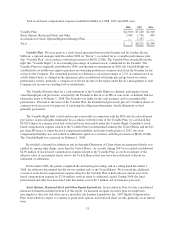
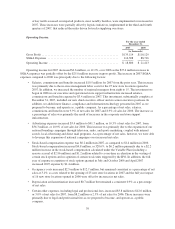
Year Ended December 31, 2008 Compared to Year Ended December 31, 2007
Net Sales.
For the year ended
December 31,
2008 2007
(dollars in thousands)
Net sales ...................................................... $482,179 $405,307
Comparable net sales increase ..................................... 1.6% 8.6%
Number of stores open at year end .................................. 150 116
Number of stores opened during the year ............................. 34 25
Net sales for 2008 increased $76.9 million, or 19.0%, over 2007 due to a $6.5 million increase in
comparable store net sales and an increase of $70.4 million in non-comparable store net sales. Overall, net sales
increased due principally to the following factors:
• A broader assortment of premium products in certain key product lines such as handscraped
hardwoods, bamboo and laminate products offered under a number of our proprietary brands,
continued to drive increased demand. Partially offsetting this benefit were decreases in the sales mix of
certain Bellawood and certain other hardwoods which generally carry a higher than average unit retail
price.
• Sales of moldings and accessories increased 36.3% and represented 11.0% of net sales in 2008, up
from 9.6% of net sales in 2007, as we continued to broaden our assortment and strengthened our
commitment to a more consistent in-stock position.
• The increased availability of special liquidation deals in 2008 allowed us to add selective merchandise
offerings that presented a value opportunity for the customer while creating promotional opportunities
for us to drive incremental consumer traffic, a portion of which was converted to demand for our
proprietary brands.
• Comparable store net sales were driven primarily by the continued maturation of stores in operation for
13 to 36 months at December 31, 2008, where net sales increased 12.8%. Net sales at these comparable
stores generally increase faster than at our mature stores, where net sales declined 0.7%.
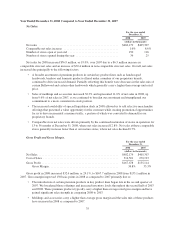
Gross Profit and Gross Margin.
For the year ended
December 31,
2008 2007
(dollars in thousands)
Net Sales ...................................................... $482,179 $405,307
Cost of Sales ................................................... 314,501 270,193
Gross Profit .................................................... $167,678 $135,114
Gross Margin ............................................... 34.8% 33.3%
Gross profit in 2008 increased $32.6 million, or 24.1%, to $167.7 million in 2008 from $135.1 million in
2007. Gross margin improved 150 basis points in 2008 as compared to 2007 primarily due to:
• The introduction of certain premium products in key product lines began late in the second quarter of
2007. We broadened those offerings and increased inventory levels throughout the second half of 2007
and 2008. These premium products typically carry a higher than average retail gross margin and have
gained significant sales strength in comparing 2008 to 2007.
• Moldings and accessories carry a higher than average gross margin and the sales mix of these products
have increased in 2008 as compared to 2007.
35