Lumber Liquidators 2008 Annual Report Download - page 46
Download and view the complete annual report
Please find page 46 of the 2008 Lumber Liquidators annual report below. You can navigate through the pages in the report by either clicking on the pages listed below, or by using the keyword search tool below to find specific information within the annual report.-
 1
1 -
2
-
3
-
4
-
5
-
6
-
7
-
8
-
9
-
10
-
11
-
12
-
13
-
14
-
15
-
16
-
17
-
18
-
19
-
20
-
21
-
22
-
23
-
24
-
25
-
26
-
27
-
28
-
29
-
30
-
31
-
32
-
33
-
34
-
35
-
 36
36 -
 37
37 -
 38
38 -
 39
39 -
 40
40 -
 41
41 -
 42
42 -
 43
43 -
 44
44 -
 45
45 -
 46
46 -
 47
47 -
 48
48 -
 49
49 -
 50
50 -
 51
51 -
 52
52 -
 53
53 -
 54
54 -
 55
55 -
 56
56 -
57
-
58
-
59
-
60
-
61
-
62
-
63
-
64
-
65
-
66
-
67
-
68
-
69
-
70
-
71
-
72
-
73
-
74
-
75
-
76
-
77
-
78
-
79
-
80
 |
 |

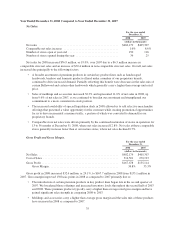
As a percentage of net sales, operating income declined to 4.6% in 2007 from 6.4% in 2006. This decrease
was primarily due to the increase in SG&A expenses as a percentage of net sales to 28.7% in 2007 from 26.7% in
2006, partially offset by a slight increase in gross margin.
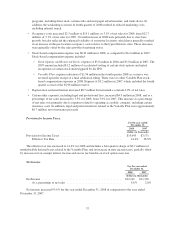
Provision for Income Taxes.
For the year ended
December 31,
2007 2006
(dollars in thousands)
Provision for Income Taxes ........................................ $7,171 $8,161
Effective Tax Rate ........................................... 38.8% 38.8%
The effective tax rate was 38.8% for both the year ended December 31, 2007 and December 31, 2006.
Net Income.
For the year ended
December 31,
2007 2006
(dollars in thousands)
Net Income ...................................................... $11,326 $12,898
As a percentage of net sales ..................................... 2.8% 3.9%
Net income decreased 12.2% for the year ended December 31, 2007 in comparison to the year ended
December 31, 2006.
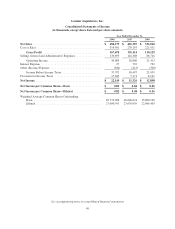
Quarterly Financial Data
The following table sets forth our unaudited quarterly results of operations for 2008 and 2007. Information
for each of these periods has been prepared on the same basis as the audited financial statements included
elsewhere in this report. This information includes all adjustments, which consist only of normal and recurring
adjustments, management considers necessary for the fair presentation of such data. This data should be read in
conjunction with the audited financial statements included elsewhere in this report. The results of operations for
historical periods are not necessarily indicative of results for any future period.
Quarter Ended
March 31,
2008
June 30,
2008
September 30,
2008
December 31,
2008
(dollars in thousands)
Net Sales ......................................... $114,549 $128,037 $123,063 $116,530
Gross Profit ....................................... $ 40,122 $ 44,255 $ 43,417 $ 39,884
Selling, General and Administrative Expenses(1) ......... $ 32,314 $ 34,934 $ 34,607 $ 28,838
Operating Income .................................. $ 7,808 $ 9,321 $ 8,810 $ 11,046
Net Income ....................................... $ 4,312 $ 5,876 $ 5,463 $ 6,498
Number of Stores Opened in Quarter ................... 9 10 8 7
Comparable Sales Increase (Decrease) .................. 7.0% 2.7% 2.0% (4.6%)
(1) Selling, General and Administrative Expenses for the quarter ended December 31 includes ($2,960) of
stock-based compensation expense for the reversal of the accrual related to the Variable Plan.
40