Lumber Liquidators 2008 Annual Report Download - page 32
Download and view the complete annual report
Please find page 32 of the 2008 Lumber Liquidators annual report below. You can navigate through the pages in the report by either clicking on the pages listed below, or by using the keyword search tool below to find specific information within the annual report.-
 1
1 -
2
-
3
-
4
-
5
-
6
-
7
-
8
-
9
-
10
-
11
-
12
-
13
-
14
-
15
-
16
-
17
-
18
-
19
-
20
-
21
-
 22
22 -
 23
23 -
 24
24 -
 25
25 -
 26
26 -
 27
27 -
 28
28 -
 29
29 -
 30
30 -
 31
31 -
 32
32 -
 33
33 -
 34
34 -
 35
35 -
 36
36 -
 37
37 -
 38
38 -
 39
39 -
 40
40 -
 41
41 -
 42
42 -
43
-
44
-
45
-
46
-
47
-
48
-
49
-
50
-
51
-
52
-
53
-
54
-
55
-
56
-
57
-
58
-
59
-
60
-
61
-
62
-
63
-
64
-
65
-
66
-
67
-
68
-
69
-
70
-
71
-
72
-
73
-
74
-
75
-
76
-
77
-
78
-
79
-
80
 |
 |
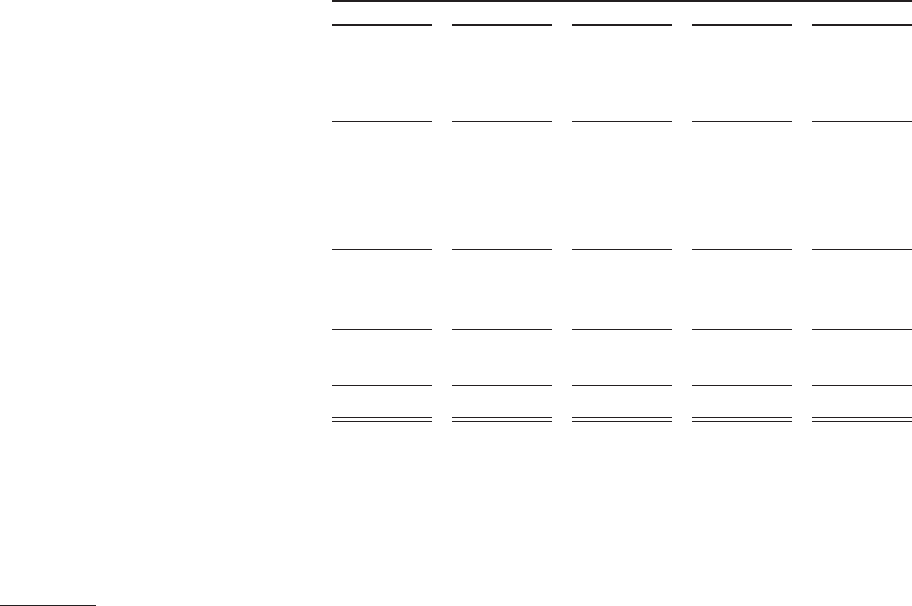
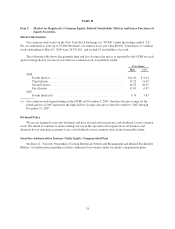
Item 6. Selected Financial Data.
The selected statements of income data for the years ended December 31, 2008, 2007, and 2006 and the
balance sheet data as of December 31, 2008 and 2007 have been derived from our audited financial statements
included in Item 8. “Financial Statements and Supplementary Data” of this report. This information should be
read in conjunction with those audited financial statements, the notes thereto, and with Item 7. “Management’s
Discussion and Analysis of Financial Condition and Results of Operations” of this report. The selected balance
sheet data set forth below as of December 31, 2006, 2005, and 2004 and income data for the years ended
December 31, 2005 and 2004 are derived from our audited financial statements contained in reports previously
filed with the SEC, not included herein. Our historical results are not necessarily indicative of our results for any
future period.
Year Ended December 31,
2008 2007 2006(1) 2005 2004
(in thousands, except share and per share amounts)
Statement of Income Data
Net sales ....................... $ 482,179 $ 405,307 $ 332,060 $ 244,947 $ 171,766
Cost of sales .................... 314,501 270,193 221,931 158,844 115,857
Gross profit ..................... 167,678 135,114 110,129 86,103 55,909
Selling, general and administrative
expenses ..................... 130,693 116,308 88,716 67,900 48,461
Impairment loss on long-lived
assets ........................ ————293
Operating income ................ 36,985 18,806 21,413 18,203 7,155
Interest expense .................. 27 722 722 638 429
Other (income) expense(2) ......... (834) (413) (368) (96) 190
Income before income taxes ........ 37,792 18,497 21,059 17,661 6,536
Provision for income taxes(3) ....... 15,643 7,171 8,161 6,948 (1,450)
Net income ..................... $ 22,149 $ 11,326 $ 12,898 $ 10,713 $ 7,986
Net income per common share:
Basic ...................... $ 0.83 $ 0.68 $ 0.86 $ 0.71 $ 0.53
Diluted ..................... $ 0.82 $ 0.48 $ 0.56 $ 0.46 $ 0.51
Weighted average common shares
outstanding:
Basic ...................... 26,772,288 16,646,674 15,000,100 15,000,100 15,000,100
Diluted ..................... 27,090,593 23,634,995 22,989,403 23,063,174 15,675,477
(1) We adopted the provisions of SFAS 123(R), using the prospective-transition method, effective January 1,
2006.
(2) Includes interest income.
(3) Effective December 1, 2004, we elected to be taxed as a “C” corporation for federal and state income tax
purposes. Prior to this election, we were not subject to federal and certain state income taxation at the
corporation level.
26