Lumber Liquidators 2008 Annual Report Download - page 45
Download and view the complete annual report
Please find page 45 of the 2008 Lumber Liquidators annual report below. You can navigate through the pages in the report by either clicking on the pages listed below, or by using the keyword search tool below to find specific information within the annual report.-
 1
1 -
2
-
3
-
4
-
5
-
6
-
7
-
8
-
9
-
10
-
11
-
12
-
13
-
14
-
15
-
16
-
17
-
18
-
19
-
20
-
21
-
22
-
23
-
24
-
25
-
26
-
27
-
28
-
29
-
30
-
31
-
32
-
33
-
34
-
 35
35 -
 36
36 -
 37
37 -
 38
38 -
 39
39 -
 40
40 -
 41
41 -
 42
42 -
 43
43 -
 44
44 -
 45
45 -
 46
46 -
 47
47 -
 48
48 -
 49
49 -
 50
50 -
 51
51 -
 52
52 -
 53
53 -
 54
54 -
 55
55 -
56
-
57
-
58
-
59
-
60
-
61
-
62
-
63
-
64
-
65
-
66
-
67
-
68
-
69
-
70
-
71
-
72
-
73
-
74
-
75
-
76
-
77
-
78
-
79
-
80
 |
 |

of key tariffs assessed on imported products, most notably bamboo, were implemented or increased in
2007. These increases were partially offset by logistic initiatives, implemented in the third and fourth
quarters of 2007, that reduced the miles driven by trucks supplying our stores.
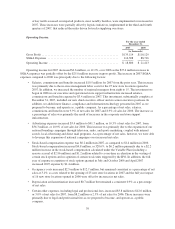
Operating Income.
For the year ended
December 31,
2007 2006
(in thousands)
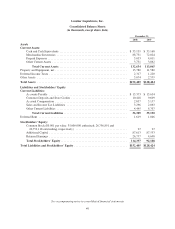
Gross Profit .................................................... $135,114 $110,129
SG&A Expenses ................................................ 116,308 88,716
Operating Income ............................................... $ 18,806 $ 21,413
Operating income for 2007 decreased $2.6 million, or 12.2%, over 2006 as the $27.6 million increase in
SG&A expenses was partially offset by the $25.0 million increase in gross profit. The increase in 2007 SG&A
expenses compared to 2006 was principally due to the following factors:
• Salaries, commissions and benefits increased $10.5 million for 2007 from the prior year. This increase
was primarily due to the in-store management labor costs for the 25 new store locations opened in
2007. In addition, we increased the number of regional managers from eight to 15. The investment we
began in 2006 in our executive and operational store support infrastructure increased salaries,
commissions and benefits expense by $3.4 million in 2007. This investment, substantially complete at
December 31, 2007, included our new chief executive officer and six senior executive positions. In
addition, we added more finance, compliance and information technology personnel in 2007 as we
prepared to become, and operate as, a public company. As a percentage of net sales, salaries,
commissions and benefits were 9.9% of net sales for 2007 and 8.9% of sales for 2006. The increase as
a percentage of sales was primarily the result of increases in the corporate and store support
infrastructure.
• Advertising expenses increased $5.4 million to $41.7 million, or 10.3% of net sales for 2007, from
$36.3 million, or 10.9% of net sales for 2006. This increase was primarily due to the expansion of our
national branding campaigns through television, radio, and sports marketing, coupled with internet
search, local advertising and direct mail programs. As a percentage of net sales, however, we were able
to leverage this expansion of national campaigns over increased net sales.
• Stock-based compensation expense was $6.2 million in 2007, as compared to $1.4 million in 2006.
Stock-based compensation increased $4.8 million, or 328.6%, to $6.2 million primarily due to a $2.2
million increase in the stock-based compensation calculated under the Variable Plan (including a
reserve accrual of $2.96 million) and $1.2 million related to a one-time acceleration in the vesting of
certain stock options and recognition of certain stock units triggered by the IPO. In addition, the full
year of expense recognition of stock options granted in July and October 2006 and April 2007
increased 2007 expense by $1.4 million.
• Occupancy costs increased $2.5 million to $12.7 million, but remained consistent as a percentage of net
sales at 3.1%, as costs related to the opening of 25 new store locations in 2007 and the full year impact
of 16 new store locations opened in 2006 were offset by increases in net sales.
• Depreciation and amortization increased $0.7 million but remained a consistent 0.9% as a percentage
of net sales.
• Certain other expenses, including legal and professional fees, increased $3.8 million to $12.0 million,
or 3.0% of net sales for 2007, from $8.2 million or 2.5% of net sales for 2006. These increases were
primarily due to legal and professional fees as we prepared to become, and operate as, a public
company.
39