Lumber Liquidators 2008 Annual Report Download - page 44
Download and view the complete annual report
Please find page 44 of the 2008 Lumber Liquidators annual report below. You can navigate through the pages in the report by either clicking on the pages listed below, or by using the keyword search tool below to find specific information within the annual report.-
 1
1 -
2
-
3
-
4
-
5
-
6
-
7
-
8
-
9
-
10
-
11
-
12
-
13
-
14
-
15
-
16
-
17
-
18
-
19
-
20
-
21
-
22
-
23
-
24
-
25
-
26
-
27
-
28
-
29
-
30
-
31
-
32
-
33
-
 34
34 -
 35
35 -
 36
36 -
 37
37 -
 38
38 -
 39
39 -
 40
40 -
 41
41 -
 42
42 -
 43
43 -
 44
44 -
 45
45 -
 46
46 -
 47
47 -
 48
48 -
 49
49 -
 50
50 -
 51
51 -
 52
52 -
 53
53 -
 54
54 -
55
-
56
-
57
-
58
-
59
-
60
-
61
-
62
-
63
-
64
-
65
-
66
-
67
-
68
-
69
-
70
-
71
-
72
-
73
-
74
-
75
-
76
-
77
-
78
-
79
-
80
 |
 |

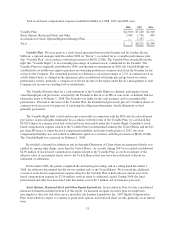
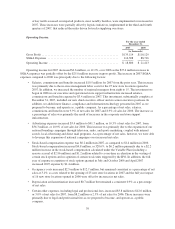
Year Ended December 31, 2007 Compared to Year Ended December 31, 2006
Net Sales.
For the year ended
December 31,
2007 2006
(dollars in thousands)
Net sales ...................................................... $405,307 $332,060
Comparable net sales increase ..................................... 8.6% 17.2%
Number of stores open at year end .................................. 116 91
Number of stores opened during the year ............................. 25 16
Net sales for 2007 increased $73.2 million, or 22.1%, over 2006 due to a $28.5 million in comparable store
net sales and an increase of $44.7 million in non-comparable store net sales. Overall, net sales increased due
principally to the following factors:
• Generally strong consumer demand for our expanded product assortment continued to drive
comparable store increases in sales volume and changes in our sales mix which increased our average
retail price per unit sold approximately 3.3%.
• In 2007, increased demand was driven in part by strength in the sales of the Bellawood line,
particularly exotic hardwoods, and the broader assortment of engineered hardwoods, including an
expanded offering of handscraped products, which offset declines in sales of liquidation deals and
unfinished hardwoods.
• Sales of moldings and accessories increased 41.0% and represented 9.6% of net sales in 2007, up from
8.3% of net sales in 2006 as we continued to broaden our assortment and strengthened our commitment
to a more consistent in-stock position.
• Net sales also benefited from the continued maturation of our store base, as net sales at stores open for
less than 36 months (51.7% of our stores in operation as of December 31, 2007) increased 26.2% more
than net sales at our more mature stores.
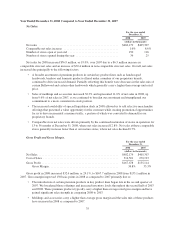
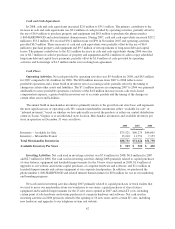
Gross Profit and Gross Margin.
For the year ended
December 31,
2007 2006
(dollars in thousands)
Net Sales ...................................................... $405,307 $332,060
Cost of Sales ................................................... 270,193 221,931
Gross Profit .................................................... $135,114 $110,129
Gross Margin ............................................... 33.3% 33.2%
Gross profit in 2007 increased $25.0 million, or 22.7%, to $135.1 million in 2007 from $110.1 million for
2006. Gross margin improved 10 basis points in 2007 as compared to 2006 primarily due to:
• The introduction of certain premium products in key product lines began late in the second quarter of
2007. We broadened those offerings and increased inventory levels throughout the second half of 2007.
These premium products typically carry a higher than average retail gross margin and gained
significant sales strength in comparing 2007 to 2006.
• In 2006, primarily in the fourth quarter, we took steps to optimize inventory levels, particularly in
certain newly introduced engineered hardwood lines, and fully clear residual liquidation purchases,
adversely impacting gross margin.
• Increases in 2007 domestic and international transportation costs adversely impacted gross margin in
comparison to 2006, as per-mile ground charges increased primarily due to higher fuel costs. A number
38