Lumber Liquidators 2008 Annual Report Download - page 47
Download and view the complete annual report
Please find page 47 of the 2008 Lumber Liquidators annual report below. You can navigate through the pages in the report by either clicking on the pages listed below, or by using the keyword search tool below to find specific information within the annual report.-
 1
1 -
2
-
3
-
4
-
5
-
6
-
7
-
8
-
9
-
10
-
11
-
12
-
13
-
14
-
15
-
16
-
17
-
18
-
19
-
20
-
21
-
22
-
23
-
24
-
25
-
26
-
27
-
28
-
29
-
30
-
31
-
32
-
33
-
34
-
35
-
36
-
 37
37 -
 38
38 -
 39
39 -
 40
40 -
 41
41 -
 42
42 -
 43
43 -
 44
44 -
 45
45 -
 46
46 -
 47
47 -
 48
48 -
 49
49 -
 50
50 -
 51
51 -
 52
52 -
 53
53 -
 54
54 -
 55
55 -
 56
56 -
 57
57 -
58
-
59
-
60
-
61
-
62
-
63
-
64
-
65
-
66
-
67
-
68
-
69
-
70
-
71
-
72
-
73
-
74
-
75
-
76
-
77
-
78
-
79
-
80
 |
 |

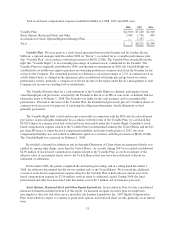
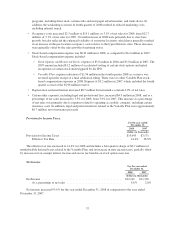
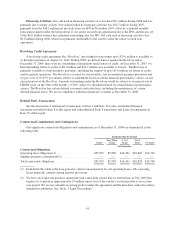
Quarter Ended
March 31,
2007
June 30,
2007
September 30,
2007
December 31,
2007
(dollars in thousands)
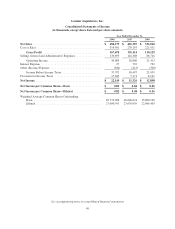
Net Sales ......................................... $92,022 $105,725 $102,050 $105,510
Gross Profit ....................................... $30,571 $ 34,375 $ 34,447 $ 35,721
Selling, General and Administrative Expenses(1) .......... $26,816 $ 30,415 $ 28,260 $ 30,817
Operating Income ................................... $ 3,755 $ 3,960 $ 6,187 $ 4,904
Net Income ........................................ $ 2,231 $ 2,345 $ 3,701 $ 3,049
Number of Stores Opened in Quarter ................... 2 10 8 5
Comparable Sales Increase ........................... 8.5% 9.0% 8.4% 8.6%
(1) Selling, General and Administrative Expenses includes $403, $2,649, ($150) and ($2,642) of variable plan
stock-based compensation expense for the quarters ended March 31, June 30, September 30, and
December 31, respectively. The quarter ended December 31, also includes $2,960 for the accrual related to
the Variable Plan and $1,224 for the acceleration of stock options and the recognition of the expense
associated with the 2006 Regional Plan due to the IPO.
Our quarterly results of operations fluctuate depending on the timing of our advertising expenses and the
timing of, and income contributed by, new stores. Our net sales also fluctuate slightly as a result of seasonal
factors. We experience slightly higher net sales in spring and fall, when more home remodeling and home
building activities are taking place, and slightly lower net sales in holiday periods and during the hottest summer
months. These seasonal fluctuations, however, are minimized to some extent by our national presence, as
markets experience different seasonal characteristics.
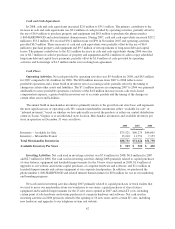
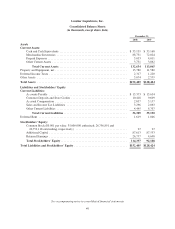
Liquidity and Capital Resources
Our principal liquidity requirements have been to meet our working capital and capital expenditure needs.
Our principal sources of liquidity are $35.1 million of cash and cash equivalents at December 31, 2008, our cash
flow from operations, and $25.0 million of availability under our revolving credit facility. We expect to use this
liquidity for general corporate purposes, including providing additional long-term capital to support the growth
of our business (primarily through opening new stores) and maintaining our existing stores. We believe that our
cash flow from operations, together with our existing liquidity sources, will be sufficient to fund our operations
and anticipated capital expenditures over at least the next 24 months.
Prior to our IPO in November 2007, we funded these requirements primarily through cash flows from
operations and short-term and long-term borrowings. Upon completion of our IPO, we received net proceeds of
approximately $36.2 million. We used a portion of those proceeds to repay $6.6 million outstanding under an
existing term-loan.
In 2009, we expect capital expenditures to total between $10.0 million and $13.0 million. In addition to with
general capital requirements, we intend to:
• open between 30 and 36 new store locations;
• continue remodeling existing store showrooms to enhance consistency in presentation;
• optimize capacity in, and product flow through, our distribution center; and
• enhance our information technology systems through integrated solutions to benefit management
reporting and planning, business continuity and disaster recovery, and overall system security.
41