LinkedIn 2013 Annual Report Download - page 93
Download and view the complete annual report
Please find page 93 of the 2013 LinkedIn annual report below. You can navigate through the pages in the report by either clicking on the pages listed below, or by using the keyword search tool below to find specific information within the annual report.-
 1
1 -
2
-
3
-
4
-
5
-
6
-
7
-
8
-
9
-
10
-
11
-
12
-
13
-
14
-
15
-
16
-
17
-
18
-
19
-
20
-
21
-
22
-
23
-
24
-
25
-
26
-
27
-
28
-
29
-
30
-
31
-
32
-
33
-
34
-
35
-
36
-
37
-
38
-
39
-
40
-
41
-
42
-
43
-
44
-
45
-
46
-
47
-
48
-
49
-
50
-
51
-
52
-
53
-
54
-
55
-
56
-
57
-
58
-
59
-
60
-
61
-
62
-
63
-
64
-
65
-
66
-
67
-
68
-
69
-
70
-
71
-
72
-
73
-
74
-
75
-
76
-
77
-
78
-
79
-
80
-
81
-
82
-
 83
83 -
 84
84 -
 85
85 -
 86
86 -
 87
87 -
 88
88 -
 89
89 -
 90
90 -
 91
91 -
 92
92 -
 93
93 -
 94
94 -
 95
95 -
 96
96 -
 97
97 -
 98
98 -
 99
99 -
 100
100 -
 101
101 -
 102
102 -
 103
103 -
104
-
105
-
106
-
107
-
108
-
109
-
110
-
111
-
112
-
113
-
114
-
115
-
116
 |
 |
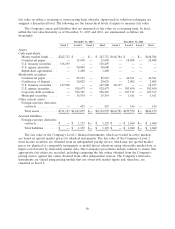
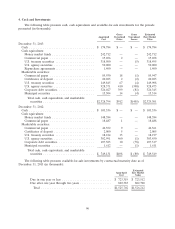
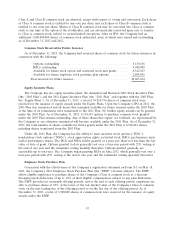
5. Property and Equipment
The following table presents the detail of property and equipment, net, for the periods presented (in
thousands):
December 31,
2013 2012
Computer equipment ............................... $347,545 $ 199,022
Software ........................................ 32,103 26,901
Capitalized website and internal-use software .............. 80,074 40,971
Furniture and fixtures ............................... 28,786 17,087
Leasehold improvements ............................. 116,887 44,362
Total ......................................... 605,395 328,343
Less accumulated depreciation and amortization ........... (243,654) (141,666)
Property and equipment, net .......................... $361,741 $ 186,677
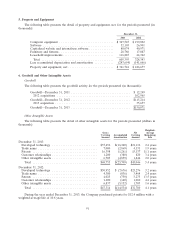
6. Goodwill and Other Intangible Assets
Goodwill
The following table presents the goodwill activity for the periods presented (in thousands):
Goodwill—December 31, 2011 .................................. $ 12,249
2012 acquisitions .......................................... 102,965
Goodwill—December 31, 2012 .................................. $115,214
2013 acquisition ........................................... 35,657
Goodwill—December 31, 2013 .................................. $150,871
Other Intangible Assets
The following table presents the detail of other intangible assets for the periods presented (dollars in
thousands):
Weighted-
Gross Net Average
Carrying Accumulated Carrying Remaining
Amount Amortization Amount Life
December 31, 2013:
Developed technology .......................... $37,452 $(16,340) $21,112 2.2 years
Trade name .................................. 7,000 (2,869) 4,131 1.9 years
Patents ..................................... 16,398 (1,261) 15,137 11.1 years
Customer relationships .......................... 1,200 (380) 820 3.4 years
Other intangible assets .......................... 6,705 (4,859) 1,846 2.0 years
Total ..................................... $68,755 $(25,709) $43,046 5.4 years
December 31, 2012:
Developed technology .......................... $30,952 $ (7,676) $23,276 3.2 years
Trade name .................................. 4,300 (836) 3,464 2.4 years
Patents ..................................... 4,025 (750) 3,275 13.5 years
Customer relationships .......................... 1,200 (140) 1,060 4.4 years
Other intangible assets .......................... 6,837 (5,132) 1,705 1.6 years
Total ..................................... $47,314 $(14,534) $32,780 4.1 years
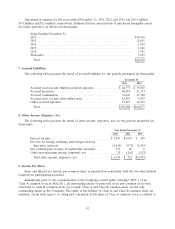
During the year ended December 31, 2013, the Company purchased patents for $12.4 million with a
weighted-average life of 10.8 years.
91