LinkedIn 2013 Annual Report Download - page 60
Download and view the complete annual report
Please find page 60 of the 2013 LinkedIn annual report below. You can navigate through the pages in the report by either clicking on the pages listed below, or by using the keyword search tool below to find specific information within the annual report.-
 1
1 -
2
-
3
-
4
-
5
-
6
-
7
-
8
-
9
-
10
-
11
-
12
-
13
-
14
-
15
-
16
-
17
-
18
-
19
-
20
-
21
-
22
-
23
-
24
-
25
-
26
-
27
-
28
-
29
-
30
-
31
-
32
-
33
-
34
-
35
-
36
-
37
-
38
-
39
-
40
-
41
-
42
-
43
-
44
-
45
-
46
-
47
-
48
-
49
-
 50
50 -
 51
51 -
 52
52 -
 53
53 -
 54
54 -
 55
55 -
 56
56 -
 57
57 -
 58
58 -
 59
59 -
 60
60 -
 61
61 -
 62
62 -
 63
63 -
 64
64 -
 65
65 -
 66
66 -
 67
67 -
 68
68 -
 69
69 -
 70
70 -
71
-
72
-
73
-
74
-
75
-
76
-
77
-
78
-
79
-
80
-
81
-
82
-
83
-
84
-
85
-
86
-
87
-
88
-
89
-
90
-
91
-
92
-
93
-
94
-
95
-
96
-
97
-
98
-
99
-
100
-
101
-
102
-
103
-
104
-
105
-
106
-
107
-
108
-
109
-
110
-
111
-
112
-
113
-
114
-
115
-
116
 |
 |

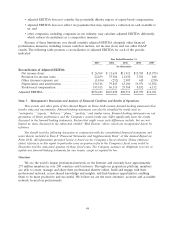
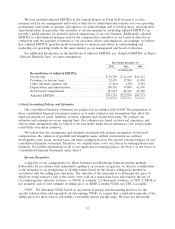
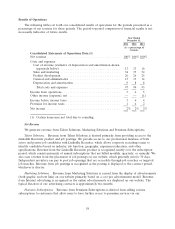
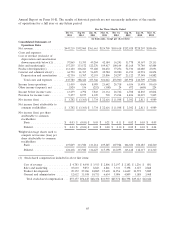
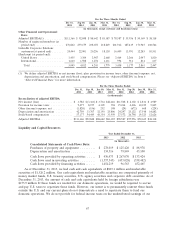
Results of Operations
The following tables set forth our consolidated results of operations for the periods presented as a
percentage of net revenue for those periods. The period-to-period comparison of financial results is not
necessarily indicative of future results.
Year Ended
December 31,
2013 2012 2011
(as a percentage of
revenue)
Consolidated Statements of Operations Data:(1)
Net revenue .......................................... 100%100%100%
Costs and expenses:
Cost of revenue (exclusive of depreciation and amortization shown
separately below) .................................. 13 13 16
Sales and marketing .................................. 34 33 32
Product development ................................. 26 26 25
General and administrative ............................. 15 13 14
Depreciation and amortization .......................... 9 8 8
Total costs and expenses ............................. 97 94 95
Income from operations ................................. 3 6 5
Other income (expense), net .............................. — — (1)
Income before income taxes .............................. 3 6 4
Provision for income taxes ............................... 1 4 2
Net income .......................................... 2% 2% 2%
(1) Certain items may not total due to rounding.
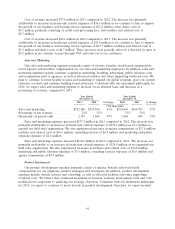
Net Revenue
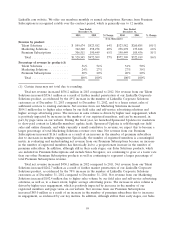
We generate revenue from Talent Solutions, Marketing Solutions and Premium Subscriptions.
Talent Solutions. Revenue from Talent Solutions is derived primarily from providing access to the
LinkedIn Recruiter product and job postings. We provide access to our professional database of both
active and passive job candidates with LinkedIn Recruiter, which allows corporate recruiting teams to
identify candidates based on industry, job function, geography, experience/education, and other
specifications. Revenue from the LinkedIn Recruiter product is recognized ratably over the subscription
period, which consists primarily of annual subscriptions that are billed monthly, quarterly, or annually. We
also earn revenue from the placement of job postings on our website, which generally run for 30 days.
Independent recruiters can pay to post job openings that are accessible through job searches or targeted
job matches. Revenue from job postings is recognized as the posting is displayed or the contract period,
whichever is shorter.
Marketing Solutions. Revenue from Marketing Solutions is earned from the display of advertisements
(both graphic and text link) on our website primarily based on a cost per advertisement model. Revenue
from Internet advertising is recognized as the online advertisements are displayed on our website. The
typical duration of our advertising contracts is approximately two months.
Premium Subscriptions. Revenue from Premium Subscriptions is derived from selling various
subscriptions to customers that allow users to have further access to premium services via our
58