LinkedIn 2013 Annual Report Download - page 70
Download and view the complete annual report
Please find page 70 of the 2013 LinkedIn annual report below. You can navigate through the pages in the report by either clicking on the pages listed below, or by using the keyword search tool below to find specific information within the annual report.-
 1
1 -
2
-
3
-
4
-
5
-
6
-
7
-
8
-
9
-
10
-
11
-
12
-
13
-
14
-
15
-
16
-
17
-
18
-
19
-
20
-
21
-
22
-
23
-
24
-
25
-
26
-
27
-
28
-
29
-
30
-
31
-
32
-
33
-
34
-
35
-
36
-
37
-
38
-
39
-
40
-
41
-
42
-
43
-
44
-
45
-
46
-
47
-
48
-
49
-
50
-
51
-
52
-
53
-
54
-
55
-
56
-
57
-
58
-
59
-
 60
60 -
 61
61 -
 62
62 -
 63
63 -
 64
64 -
 65
65 -
 66
66 -
 67
67 -
 68
68 -
 69
69 -
 70
70 -
 71
71 -
 72
72 -
 73
73 -
 74
74 -
 75
75 -
 76
76 -
 77
77 -
 78
78 -
 79
79 -
 80
80 -
81
-
82
-
83
-
84
-
85
-
86
-
87
-
88
-
89
-
90
-
91
-
92
-
93
-
94
-
95
-
96
-
97
-
98
-
99
-
100
-
101
-
102
-
103
-
104
-
105
-
106
-
107
-
108
-
109
-
110
-
111
-
112
-
113
-
114
-
115
-
116
 |
 |
foreign subsidiaries. However, we believe the income tax liability would be insignificant if these earnings
were to be repatriated. We believe that our existing cash and cash equivalents and marketable securities
balances, together with cash generated from operations, will be sufficient to meet our working capital
expenditure requirements for at least the next 12 months.
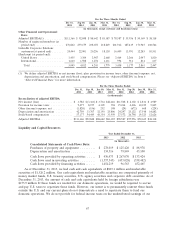
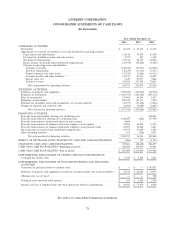
Operating Activities
Operating activities provided $436.5 million of cash in 2013, as a result of our improved operating
performance compared to 2012. The cash flow from operating activities consisted primarily of the changes
in our operating assets and liabilities, with deferred revenue increasing $134.5 million and accounts
payable and other liabilities increasing $114.7 million, partially offset by an increase in accounts receivable
of $102.6 million, and an increase in excess tax benefit from stock-based compensation of $43.8 million,
which is reclassified as a financing activity. The increases in our deferred revenue and accounts payable
and other liabilities were primarily due to increases in transaction volumes in 2013 compared to 2012. We
had net income in 2013 of $26.8 million, which included non-cash stock-based compensation of
$193.9 million and non-cash depreciation and amortization of $134.5 million.
Operating activities provided $267.1 million of cash in 2012, primarily resulting from our improved
operating performance as compared to the prior year. The cash flow from operating activities consisted
primarily of the changes in our operating assets and liabilities, with deferred revenue increasing
$117.9 million and accounts payable and other liabilities increasing $85.6 million, partially offset by an
increase in accounts receivable of $91.3 million, an increase in excess tax benefit from the exercise of
stock options of $35.8 million, which is reclassified as a financing activity, and an increase in prepaid
expenses and other assets of $7.7 million. The increases in our deferred revenue and accounts receivable
were primarily due to increases in transaction volumes in 2012 compared to 2011. We had net income in
2012 of $21.6 million, which included non-cash depreciation and amortization of $79.8 million and
non-cash stock-based compensation of $86.3 million.
Operating activities provided $133.4 million of cash in 2011, primarily resulting from our improved
operating performance as compared to the prior year. The cash flow from operating activities primarily
resulted from changes in our operating assets and liabilities, with deferred revenue increasing
$74.8 million and accounts payable and other liabilities increasing $37.0 million, partially offset by an
increase in accounts receivable of $54.9 million and an increase in prepaid expenses and other assets of
$14.1 million. The increases in our deferred revenue and accounts receivable were primarily due to our
revenue growth in 2011 as compared to 2010. We had net income in 2011 of $11.9 million, which included
non-cash depreciation and amortization of $43.1 million and non-cash stock-based compensation of
$29.8 million.
Investing Activities
Our primary investing activities consisted of purchases of investments, purchases of property and
equipment specifically related to the build out of our data centers, as well as payments for intangible
assets and strategic acquisitions. We also continued to invest in technology hardware to support our
growth, software to support website functionality development, website operations and our corporate
infrastructure. Purchases of property and equipment may vary from period to period due to the timing of
the expansion of our operations and website and internal-use software development. We expect to
continue to invest in property and equipment and development of software in 2014. Our planned
purchases of property and equipment for 2014 are expected to be in the range of $365 million and
$385 million.
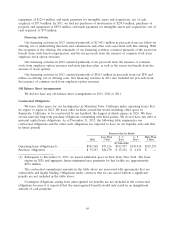
In 2013, we had net purchases of investments of $1,055.4 million, purchases of property and
equipment of $278.0 million, and payments for intangible assets and acquisitions, net of cash acquired, of
$19.2 million. In 2012, we had net purchases of investments of $245.5 million, purchases of property and
68