LinkedIn 2013 Annual Report Download - page 45
Download and view the complete annual report
Please find page 45 of the 2013 LinkedIn annual report below. You can navigate through the pages in the report by either clicking on the pages listed below, or by using the keyword search tool below to find specific information within the annual report.-
 1
1 -
2
-
3
-
4
-
5
-
6
-
7
-
8
-
9
-
10
-
11
-
12
-
13
-
14
-
15
-
16
-
17
-
18
-
19
-
20
-
21
-
22
-
23
-
24
-
25
-
26
-
27
-
28
-
29
-
30
-
31
-
32
-
33
-
34
-
 35
35 -
 36
36 -
 37
37 -
 38
38 -
 39
39 -
 40
40 -
 41
41 -
 42
42 -
 43
43 -
 44
44 -
 45
45 -
 46
46 -
 47
47 -
 48
48 -
 49
49 -
 50
50 -
 51
51 -
 52
52 -
 53
53 -
 54
54 -
 55
55 -
56
-
57
-
58
-
59
-
60
-
61
-
62
-
63
-
64
-
65
-
66
-
67
-
68
-
69
-
70
-
71
-
72
-
73
-
74
-
75
-
76
-
77
-
78
-
79
-
80
-
81
-
82
-
83
-
84
-
85
-
86
-
87
-
88
-
89
-
90
-
91
-
92
-
93
-
94
-
95
-
96
-
97
-
98
-
99
-
100
-
101
-
102
-
103
-
104
-
105
-
106
-
107
-
108
-
109
-
110
-
111
-
112
-
113
-
114
-
115
-
116
 |
 |
10APR201421263966
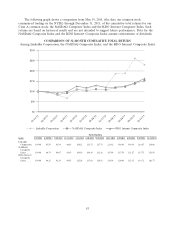
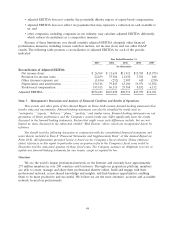
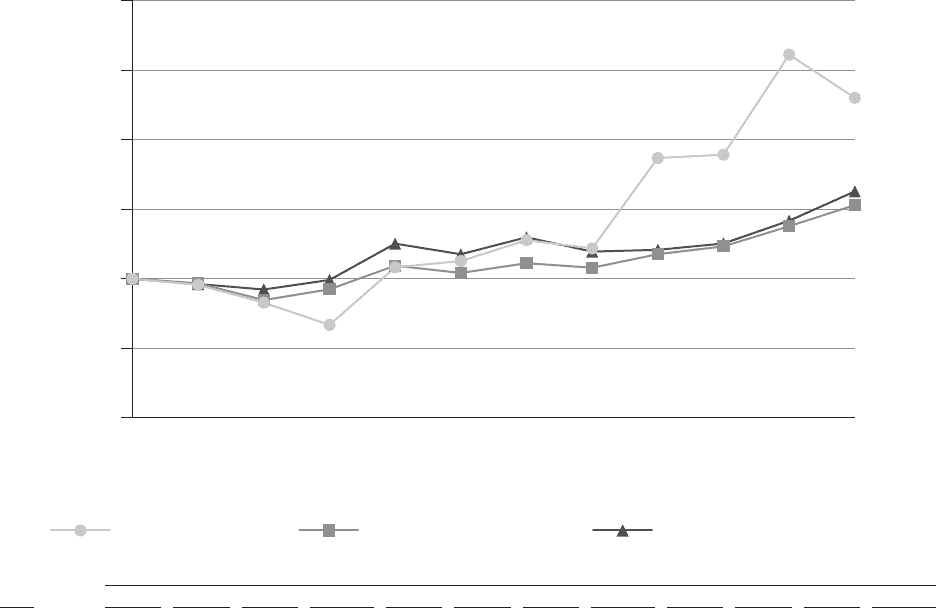
The following graph shows a comparison from May 19, 2011, (the date our common stock
commenced trading on the NYSE) through December 31, 2013, of the cumulative total returns for our
Class A common stock, the NASDAQ Composite Index and the RDG Internet Composite Index. Such
returns are based on historical results and are not intended to suggest future performance. Data for the
NASDAQ Composite Index and the RDG Internet Composite Index assume reinvestment of dividends.
COMPARISON OF 32 MONTH CUMULATIVE TOTAL RETURN
Among LinkedIn Corporation, the NASDAQ Composite Index, and the RDG Internet Composite Index
$0
$50
$100
$150
$200
$250
LinkedIn Corporation NASDAQ Composite Index RDG Internet Composite Index
05/19/11
06/30/11
09/30/11
12/30/11
03/30/12
06/29/12
09/28/12
12/31/12
03/28/13
06/28/13
09/30/13
$300
12/31/13
Period Ending
Index 5/19/2011 6/30/2011 9/30/2011 12/31/2011 3/31/2012 6/30/2012 9/30/2012 12/31/2012 3/28/2013 6/28/2013 9/30/2013 12/31/2013
LinkedIn
Corporation 100.00 95.59 82.84 66.85 108.21 112.75 127.75 121.82 186.80 189.18 261.07 230.06
NASDAQ
Composite
Index .... 100.00 96.74 84.67 92.45 109.39 104.19 111.16 107.94 117.70 123.27 137.75 152.95
RDG Internet
Composite
Index .... 100.00 96.25 92.28 99.15 125.24 117.63 129.81 119.54 120.80 125.35 141.71 162.77
43