LinkedIn 2013 Annual Report Download - page 101
Download and view the complete annual report
Please find page 101 of the 2013 LinkedIn annual report below. You can navigate through the pages in the report by either clicking on the pages listed below, or by using the keyword search tool below to find specific information within the annual report.-
 1
1 -
2
-
3
-
4
-
5
-
6
-
7
-
8
-
9
-
10
-
11
-
12
-
13
-
14
-
15
-
16
-
17
-
18
-
19
-
20
-
21
-
22
-
23
-
24
-
25
-
26
-
27
-
28
-
29
-
30
-
31
-
32
-
33
-
34
-
35
-
36
-
37
-
38
-
39
-
40
-
41
-
42
-
43
-
44
-
45
-
46
-
47
-
48
-
49
-
50
-
51
-
52
-
53
-
54
-
55
-
56
-
57
-
58
-
59
-
60
-
61
-
62
-
63
-
64
-
65
-
66
-
67
-
68
-
69
-
70
-
71
-
72
-
73
-
74
-
75
-
76
-
77
-
78
-
79
-
80
-
81
-
82
-
83
-
84
-
85
-
86
-
87
-
88
-
89
-
90
-
 91
91 -
 92
92 -
 93
93 -
 94
94 -
 95
95 -
 96
96 -
 97
97 -
 98
98 -
 99
99 -
 100
100 -
 101
101 -
 102
102 -
 103
103 -
 104
104 -
 105
105 -
 106
106 -
 107
107 -
 108
108 -
 109
109 -
 110
110 -
 111
111 -
112
-
113
-
114
-
115
-
116
 |
 |

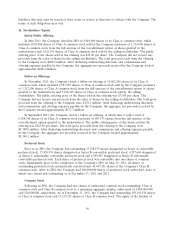
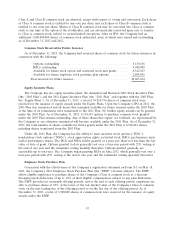
RSU Activity
A summary of RSU activity for the year ended December 31, 2013, is as follows:
Weighted-
Average
Number of Grant Date
Shares Fair Value
Unvested—December 31, 2012 ........................ 3,239,272 $ 94.69
Granted ......................................... 2,313,018 189.75
Released ........................................ (1,154,252) 103.51
Canceled or expired ................................ (349,949) 117.43
Unvested—December 31, 2013 ........................ 4,048,089 $144.53
As of December 31, 2013, total unrecognized compensation cost, adjusted for estimated forfeitures,
related to RSUs was approximately $450.1 million, which is expected to be recognized over the next
2.93 years.
Restricted Stock
In connection with Pulse, Slideshare and other acquisitions, the Company issued restricted stock. As
of December 31, 2013, the total unrecognized compensation cost related to restricted stock was
approximately $39.7 million, which is expected to be recognized over the next 2.42 years.
Stock-Based Compensation Expense
The fair value of options granted to employees is estimated on the grant date using the Black-Scholes
option valuation model. This valuation model for stock-based compensation expense requires the
Company to make assumptions and judgments about the variables used in the calculation, including the
fair value of the Company’s common stock, the expected term (the period of time that the options
granted are expected to be outstanding), the volatility of the Company’s common stock, a risk-free interest
rate, and expected dividends. The Company also estimates forfeitures of unvested stock options. To the
extent actual forfeitures differ from the estimates, the difference will be recorded as a cumulative
adjustment in the period estimates are revised. No compensation cost is recorded for options that do not
vest. The Company uses the simplified calculation of expected life described in the SEC’s Staff
Accounting Bulletin No. 107, Share-Based Payment, and volatility for stock options is based on an average
of the historical volatilities of the common stock of several entities with characteristics similar to those of
the Company. The Company will continue to use the simplified method until it has sufficient historical
exercise data to estimate the expected life of the options. The volatility for ESPP is based on the
historical volatility of the Company’s common stock. The risk-free rate is based on the U.S. Treasury yield
curve in effect at the time of grant for periods corresponding with the expected life of the option. The
Company uses an expected dividend yield of zero as it does not anticipate paying any dividends in the
foreseeable future. Expected forfeitures are based on the Company’s historical experience.
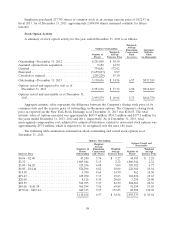
The following table presents the weighted-average assumptions used to estimate the fair value of
options granted during the periods presented, excluding assumed acquisition-related stock options:
Year Ended
December 31,
2013 2012 2011
Volatility .......................................... 54% 54% 55%
Expected dividend yield ............................... — — —
Risk-free rate ...................................... 1.15% 0.95% 2.58%
Expected term (in years) .............................. 6.27 6.08 6.07
99