LinkedIn 2013 Annual Report Download - page 67
Download and view the complete annual report
Please find page 67 of the 2013 LinkedIn annual report below. You can navigate through the pages in the report by either clicking on the pages listed below, or by using the keyword search tool below to find specific information within the annual report.-
 1
1 -
2
-
3
-
4
-
5
-
6
-
7
-
8
-
9
-
10
-
11
-
12
-
13
-
14
-
15
-
16
-
17
-
18
-
19
-
20
-
21
-
22
-
23
-
24
-
25
-
26
-
27
-
28
-
29
-
30
-
31
-
32
-
33
-
34
-
35
-
36
-
37
-
38
-
39
-
40
-
41
-
42
-
43
-
44
-
45
-
46
-
47
-
48
-
49
-
50
-
51
-
52
-
53
-
54
-
55
-
56
-
 57
57 -
 58
58 -
 59
59 -
 60
60 -
 61
61 -
 62
62 -
 63
63 -
 64
64 -
 65
65 -
 66
66 -
 67
67 -
 68
68 -
 69
69 -
 70
70 -
 71
71 -
 72
72 -
 73
73 -
 74
74 -
 75
75 -
 76
76 -
 77
77 -
78
-
79
-
80
-
81
-
82
-
83
-
84
-
85
-
86
-
87
-
88
-
89
-
90
-
91
-
92
-
93
-
94
-
95
-
96
-
97
-
98
-
99
-
100
-
101
-
102
-
103
-
104
-
105
-
106
-
107
-
108
-
109
-
110
-
111
-
112
-
113
-
114
-
115
-
116
 |
 |

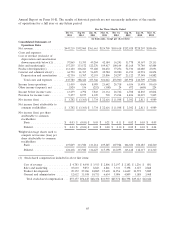
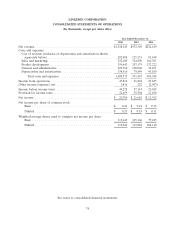
Annual Report on Form 10-K. The results of historical periods are not necessarily indicative of the results
of operations for a full year or any future period.
For the Three Months Ended
Dec 31, Sep 30, Jun 30, Mar 31, Dec 31, Sep 30, Jun 30, Mar 31,
2013 2013 2013 2013 2012 2012 2012 2012
(in thousands, except per share data)
Consolidated Statements of
Operations Data:
Net revenue .................. $447,219 $392,960 $363,661 $324,705 $303,618 $252,028 $228,207 $188,456
Costs and expenses:
Cost of revenue (exclusive of
depreciation and amortization
shown separately below)(1) ...... 57,865 53,395 49,264 42,384 36,243 33,778 30,367 25,133
Sales and marketing(1) .......... 157,235 133,172 122,276 109,417 100,104 83,168 75,740 65,884
Product development(1) ......... 113,140 106,223 95,608 80,672 77,276 72,730 60,080 47,093
General and administrative(1) ..... 64,790 61,767 56,225 42,784 38,980 33,194 30,974 24,854
Depreciation and amortization . . . 42,750 33,767 32,193 25,806 24,297 23,122 17,548 14,882
Total costs and expenses ...... 435,780 388,324 355,566 301,063 276,900 245,992 214,709 177,846
Income from operations ......... 11,439 4,636 8,095 23,642 26,718 6,036 13,498 10,610
Other income (expense), net ...... 1,820 156 (252) (308) 24 672 (668) 224
Income before income taxes ....... 13,259 4,792 7,843 23,334 26,742 6,708 12,830 10,834
Provision for income taxes ........ 9,477 8,155 4,109 718 15,234 4,406 10,019 5,845
Net income (loss) .............. $ 3,782 $ (3,363) $ 3,734 $ 22,616 $ 11,508 $ 2,302 $ 2,811 $ 4,989
Net income (loss) attributable to
common stockholders .......... $ 3,782 $ (3,363) $ 3,734 $ 22,616 $ 11,508 $ 2,302 $ 2,811 $ 4,989
Net income (loss) per share
attributable to common
stockholders:
Basic ................... $ 0.03 $ (0.03) $ 0.03 $ 0.21 $ 0.11 $ 0.02 $ 0.03 $ 0.05
Diluted .................. $ 0.03 $ (0.03) $ 0.03 $ 0.20 $ 0.10 $ 0.02 $ 0.03 $ 0.04
Weighted-average shares used to
compute net income (loss) per
share attributable to common
stockholders:
Basic ................... 119,849 113,940 111,214 109,445 107,924 106,304 104,185 102,210
Diluted .................. 124,438 113,940 116,627 115,398 114,095 113,618 112,317 111,310
(1) Stock-based compensation included in above line items:
Cost of revenue ............... $4,783 $ 4,098 $ 3,913 $ 2,806 $ 2,197 $ 2,182 $ 1,236 $ 801
Sales and marketing ............ 10,630 9,853 8,843 6,861 5,333 5,198 4,327 2,868
Product development ........... 29,152 27,186 24,885 17,638 14,956 14,609 10,572 5,889
General and administrative ....... 12,612 13,308 10,713 6,634 5,086 4,809 3,188 3,068
Total stock-based compensation . . . $57,177 $54,445 $48,354 $33,939 $27,572 $26,798 $19,323 $12,626
65