LinkedIn 2013 Annual Report Download - page 52
Download and view the complete annual report
Please find page 52 of the 2013 LinkedIn annual report below. You can navigate through the pages in the report by either clicking on the pages listed below, or by using the keyword search tool below to find specific information within the annual report.-
 1
1 -
2
-
3
-
4
-
5
-
6
-
7
-
8
-
9
-
10
-
11
-
12
-
13
-
14
-
15
-
16
-
17
-
18
-
19
-
20
-
21
-
22
-
23
-
24
-
25
-
26
-
27
-
28
-
29
-
30
-
31
-
32
-
33
-
34
-
35
-
36
-
37
-
38
-
39
-
40
-
41
-
 42
42 -
 43
43 -
 44
44 -
 45
45 -
 46
46 -
 47
47 -
 48
48 -
 49
49 -
 50
50 -
 51
51 -
 52
52 -
 53
53 -
 54
54 -
 55
55 -
 56
56 -
 57
57 -
 58
58 -
 59
59 -
 60
60 -
 61
61 -
 62
62 -
63
-
64
-
65
-
66
-
67
-
68
-
69
-
70
-
71
-
72
-
73
-
74
-
75
-
76
-
77
-
78
-
79
-
80
-
81
-
82
-
83
-
84
-
85
-
86
-
87
-
88
-
89
-
90
-
91
-
92
-
93
-
94
-
95
-
96
-
97
-
98
-
99
-
100
-
101
-
102
-
103
-
104
-
105
-
106
-
107
-
108
-
109
-
110
-
111
-
112
-
113
-
114
-
115
-
116
 |
 |

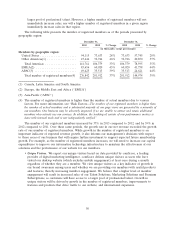
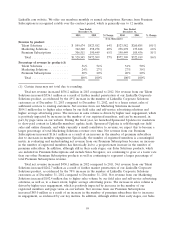
larger pool of professional talent. However, a higher number of registered members will not
immediately increase sales, nor will a higher number of registered members in a given region
immediately increase sales in that region.
The following table presents the number of registered members as of the periods presented by
geographic region:
December 31, December 31,
2013 2012 % Change 2012 2011 % Change
(in thousands, except percentages)
Members by geographic region:
United States ..................... 94,115 73,633 28% 73,633 57,745 28%
Other Americas(1) ................. 47,646 32,746 46% 32,746 20,850 57%
Total Americas .................. 141,761 106,379 33% 106,379 78,595 35%
EMEA(2) ....................... 85,656 60,020 43% 60,020 41,758 44%
APAC(3) ........................ 49,425 35,513 39% 35,513 24,621 44%
Total number of registered members(4) 276,842 201,912 37% 201,912 144,974 39%
(1) Canada, Latin America and South America
(2) Europe, the Middle East and Africa (‘‘EMEA’’)
(3) Asia-Pacific (‘‘APAC’’)
(4) The number of registered members is higher than the number of actual members due to various
factors. For more information, see ‘‘Risk Factors—The number of our registered members is higher than
the number of actual members and a substantial majority of our page views are generated by a minority of
our members. Our business may be adversely impacted if we are unable to attract and retain additional
members who actively use our services. In addition, the tracking of certain of our performance metrics is
done with internal tools and is not independently verified.’’
The number of our registered members increased by 37% in 2013 compared to 2012, and by 39% in
2012 compared to 2011. Over these same periods, the growth rate in our net revenue exceeded the growth
rate of our number of registered members. While growth in the number of registered members is an
important indicator of expected revenue growth, it also informs our management’s decisions with respect
to those areas of our business that will require further investment to support expected future membership
growth. For example, as the number of registered members increases, we will need to increase our capital
expenditures to improve our information technology infrastructure to maintain the effectiveness of our
solutions and the performance of our website for our members.
•Unique Visitors. We report our unique visitors based on data provided by comScore, a leading
provider of digital marketing intelligence. comScore defines unique visitors as users who have
visited our desktop website (which excludes mobile engagement) at least once during a month
regardless of whether they are a member. We view unique visitors as a key indicator of growth in
our brand awareness among users and whether we are providing our members with useful products
and features, thereby increasing member engagement. We believe that a higher level of member
engagement will result in increased sales of our Talent Solutions, Marketing Solutions and Premium
Subscriptions, as customers will have access to a larger pool of professional talent. Growth in
unique visitors will be driven by growth in the number of registered members, improvements to
features and products that drive traffic to our website, and international expansion.
50