LinkedIn 2013 Annual Report Download - page 76
Download and view the complete annual report
Please find page 76 of the 2013 LinkedIn annual report below. You can navigate through the pages in the report by either clicking on the pages listed below, or by using the keyword search tool below to find specific information within the annual report.-
 1
1 -
2
-
3
-
4
-
5
-
6
-
7
-
8
-
9
-
10
-
11
-
12
-
13
-
14
-
15
-
16
-
17
-
18
-
19
-
20
-
21
-
22
-
23
-
24
-
25
-
26
-
27
-
28
-
29
-
30
-
31
-
32
-
33
-
34
-
35
-
36
-
37
-
38
-
39
-
40
-
41
-
42
-
43
-
44
-
45
-
46
-
47
-
48
-
49
-
50
-
51
-
52
-
53
-
54
-
55
-
56
-
57
-
58
-
59
-
60
-
61
-
62
-
63
-
64
-
65
-
 66
66 -
 67
67 -
 68
68 -
 69
69 -
 70
70 -
 71
71 -
 72
72 -
 73
73 -
 74
74 -
 75
75 -
 76
76 -
 77
77 -
 78
78 -
 79
79 -
 80
80 -
 81
81 -
 82
82 -
 83
83 -
 84
84 -
 85
85 -
 86
86 -
87
-
88
-
89
-
90
-
91
-
92
-
93
-
94
-
95
-
96
-
97
-
98
-
99
-
100
-
101
-
102
-
103
-
104
-
105
-
106
-
107
-
108
-
109
-
110
-
111
-
112
-
113
-
114
-
115
-
116
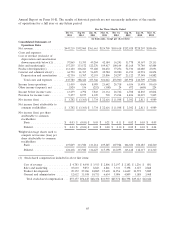
 |
 |

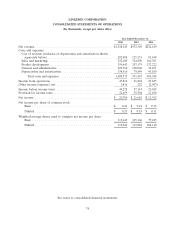
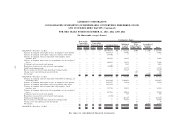
LINKEDIN CORPORATION
CONSOLIDATED STATEMENTS OF OPERATIONS
(In thousands, except per share data)
Year Ended December 31,
2013 2012 2011
Net revenue ........................................... $1,528,545 $972,309 $522,189
Costs and expenses:
Cost of revenue (exclusive of depreciation and amortization shown
separately below) .................................... 202,908 125,521 81,448
Sales and marketing ................................... 522,100 324,896 164,703
Product development ................................... 395,643 257,179 132,222
General and administrative .............................. 225,566 128,002 74,871
Depreciation and amortization ............................ 134,516 79,849 43,100
Total costs and expenses ............................. 1,480,733 915,447 496,344
Income from operations .................................. 47,812 56,862 25,845
Other income (expense), net ............................... 1,416 252 (2,903)
Income before income taxes ............................... 49,228 57,114 22,942
Provision for income taxes ................................. 22,459 35,504 11,030
Net income ........................................... $ 26,769 $ 21,610 $ 11,912
Net income per share of common stock:
Basic ............................................. $ 0.24 $ 0.21 $ 0.15
Diluted ........................................... $ 0.23 $ 0.19 $ 0.11
Weighted-average shares used to compute net income per share:
Basic ............................................. 113,643 105,166 77,185
Diluted ........................................... 118,944 112,844 104,118
See notes to consolidated financial statements.
74