LinkedIn 2013 Annual Report Download - page 80
Download and view the complete annual report
Please find page 80 of the 2013 LinkedIn annual report below. You can navigate through the pages in the report by either clicking on the pages listed below, or by using the keyword search tool below to find specific information within the annual report.-
 1
1 -
2
-
3
-
4
-
5
-
6
-
7
-
8
-
9
-
10
-
11
-
12
-
13
-
14
-
15
-
16
-
17
-
18
-
19
-
20
-
21
-
22
-
23
-
24
-
25
-
26
-
27
-
28
-
29
-
30
-
31
-
32
-
33
-
34
-
35
-
36
-
37
-
38
-
39
-
40
-
41
-
42
-
43
-
44
-
45
-
46
-
47
-
48
-
49
-
50
-
51
-
52
-
53
-
54
-
55
-
56
-
57
-
58
-
59
-
60
-
61
-
62
-
63
-
64
-
65
-
66
-
67
-
68
-
69
-
 70
70 -
 71
71 -
 72
72 -
 73
73 -
 74
74 -
 75
75 -
 76
76 -
 77
77 -
 78
78 -
 79
79 -
 80
80 -
 81
81 -
 82
82 -
 83
83 -
 84
84 -
 85
85 -
 86
86 -
 87
87 -
 88
88 -
 89
89 -
 90
90 -
91
-
92
-
93
-
94
-
95
-
96
-
97
-
98
-
99
-
100
-
101
-
102
-
103
-
104
-
105
-
106
-
107
-
108
-
109
-
110
-
111
-
112
-
113
-
114
-
115
-
116
 |
 |

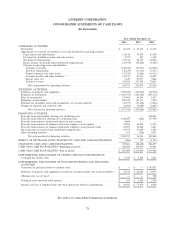
LINKEDIN CORPORATION
CONSOLIDATED STATEMENTS OF CASH FLOWS
(In thousands)
Year Ended December 31,
2013 2012 2011
OPERATING ACTIVITIES:
Net income .................................................. $ 26,769 $ 21,610 $ 11,912
Adjustments to reconcile net income to net cash provided by operating activities:
Depreciation and amortization ..................................... 134,516 79,849 43,100
Provision for doubtful accounts and sales returns ......................... 4,775 623 3,109
Stock-based compensation ........................................ 193,915 86,319 29,768
Excess income tax benefit from stock-based compensation ................... (43,755) (35,829) (1,600)
Changes in operating assets and liabilities:
Accounts receivable .......................................... (102,618) (91,277) (54,908)
Deferred commissions ......................................... (18,249) (17,145) (5,271)
Prepaid expenses and other assets ................................. (11,213) (7,663) (14,111)
Accounts payable and other liabilities ............................... 114,713 85,561 36,950
Income taxes, net ............................................ 3,120 27,077 9,662
Deferred revenue ............................................ 134,500 117,945 74,813
Net cash provided by operating activities ............................ 436,473 267,070 133,424
INVESTING ACTIVITIES:
Purchases of property and equipment .................................. (278,019) (125,420) (88,978)
Purchases of investments .......................................... (1,493,754) (443,992) (251,174)
Sales of investments ............................................. 179,904 58,594 8,255
Maturities of investments .......................................... 258,425 139,911 3,500
Payments for intangible assets and acquisitions, net of cash acquired .............. (19,197) (57,036) (7,404)
Changes in deposits and restricted cash ................................. (4,904) (5,085) (2,681)
Net cash used in investing activities ............................... (1,357,545) (433,028) (338,482)
FINANCING ACTIVITIES:
Proceeds from initial public offering, net of offering costs ..................... — — 248,803
Proceeds from follow-on offering, net of offering costs ....................... 1,348,059 (382) 177,700
Proceeds from issuance of preferred shares in joint venture .................... 4,600 — —
Proceeds from issuance of common stock from employee stock options ............. 32,824 44,402 13,124
Proceeds from issuance of common stock from employee stock purchase plan ........ 24,589 16,862 6,287
Excess income tax benefit from stock-based compensation ..................... 43,755 35,829 1,600
Other financing activities .......................................... 392 (148) 4,951
Net cash provided by financing activities ............................ 1,454,219 96,563 452,465
EFFECT OF EXCHANGE RATE CHANGES ON CASH AND CASH EQUIVALENTS . . (466) 755 (1,310)
CHANGE IN CASH AND CASH EQUIVALENTS .......................... 532,681 (68,640) 246,097
CASH AND CASH EQUIVALENTS—Beginning of period ..................... 270,408 339,048 92,951
CASH AND CASH EQUIVALENTS—End of period ......................... $ 803,089 $ 270,408 $ 339,048
SUPPLEMENTAL DISCLOSURES OF OTHER CASH FLOW INFORMATION:
Cash paid for income taxes ........................................ $ 6,049 $ 2,828 $ 2,261
SUPPLEMENTAL DISCLOSURES OF NONCASH INVESTING AND FINANCING
ACTIVITIES:
Conversion of preferred stock to common stock ........................... $ — $ — $103,827
Purchases of property and equipment recorded in accounts payable and accrued liabilities . $ 25,724 $ 22,223 $ 10,974
Offering costs not yet paid ......................................... $ — $ — $ 382
Vesting of early exercised stock options ................................. $ 937 $ 3,365 $ 3,704
Issuance of Class A common stock and stock options for business combinations ....... $ 40,927 $ 71,478 $ 8,059
See notes to consolidated financial statements.
78