LinkedIn 2013 Annual Report Download - page 63
Download and view the complete annual report
Please find page 63 of the 2013 LinkedIn annual report below. You can navigate through the pages in the report by either clicking on the pages listed below, or by using the keyword search tool below to find specific information within the annual report.-
 1
1 -
2
-
3
-
4
-
5
-
6
-
7
-
8
-
9
-
10
-
11
-
12
-
13
-
14
-
15
-
16
-
17
-
18
-
19
-
20
-
21
-
22
-
23
-
24
-
25
-
26
-
27
-
28
-
29
-
30
-
31
-
32
-
33
-
34
-
35
-
36
-
37
-
38
-
39
-
40
-
41
-
42
-
43
-
44
-
45
-
46
-
47
-
48
-
49
-
50
-
51
-
52
-
 53
53 -
 54
54 -
 55
55 -
 56
56 -
 57
57 -
 58
58 -
 59
59 -
 60
60 -
 61
61 -
 62
62 -
 63
63 -
 64
64 -
 65
65 -
 66
66 -
 67
67 -
 68
68 -
 69
69 -
 70
70 -
 71
71 -
 72
72 -
 73
73 -
74
-
75
-
76
-
77
-
78
-
79
-
80
-
81
-
82
-
83
-
84
-
85
-
86
-
87
-
88
-
89
-
90
-
91
-
92
-
93
-
94
-
95
-
96
-
97
-
98
-
99
-
100
-
101
-
102
-
103
-
104
-
105
-
106
-
107
-
108
-
109
-
110
-
111
-
112
-
113
-
114
-
115
-
116
 |
 |

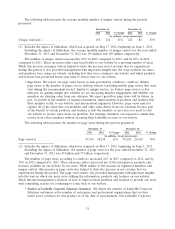
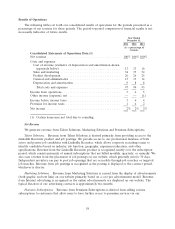
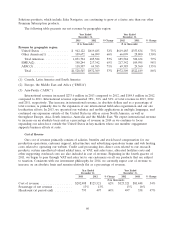
Cost of revenue increased $77.4 million in 2013 compared to 2012. The increase was primarily
attributable to increases in headcount related expenses of $36.5 million as we continue to hire to support
the growth of our business, web hosting service expenses of $21.8 million, other direct costs of
$9.1 million, primarily consisting of credit card processing fees, and facilities and related costs of
$8.7 million.
Cost of revenue increased $44.1 million in 2012 compared to 2011. The increase was primarily
attributable to increases in headcount related expenses of $25.8 million as we continue to hire to support
the growth of our business, web hosting service expenses of $13.7 million, facilities and related costs of
$5.2 million and direct costs of $4.7 million. These increases were partially offset by a decrease in taxes of
$5.0 million as we continue to pass through VAT and sales tax to our customers.
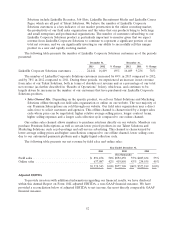
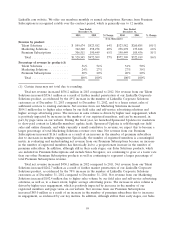
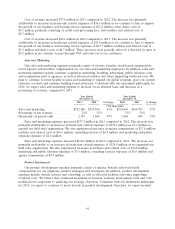
Sales and Marketing
Our sales and marketing expenses primarily consist of salaries, benefits, stock-based compensation,
travel expense and incentive compensation for our sales and marketing employees. In addition, sales and
marketing expenses include customer acquisition marketing, branding, advertising, public relations costs,
and commissions paid to agencies, as well as allocated facilities and other supporting overhead costs. We
plan to continue to invest heavily in sales and marketing to expand our global footprint, grow our current
customer accounts and continue building brand awareness. Consistent with our investment philosophy for
2014, we expect sales and marketing expense to increase on an absolute basis and decrease as a
percentage of revenue, compared to 2013.
Year Ended Year Ended
December 31, December 31,
2013 2012 % Change 2012 2011 % Change
($ in thousands)
Sales and marketing .............. $522,100 $324,896 61% $324,896 $164,703 97%
Percentage of net revenue .......... 34% 33% 33% 32%
Headcount (at period end) ......... 2,159 1,468 47% 1,468 844 74%
Sales and marketing expenses increased $197.2 million in 2013 compared to 2012. The increase was
primarily attributable to an increase in headcount related expenses of $152.2 million as we continue to
expand our field sales organization. We also experienced increases in agency commissions of $17.8 million,
facilities and related costs of $16.6 million, consulting services of $6.8 million and marketing and public
relations expenses of $2.6 million.
Sales and marketing expenses increased $160.2 million in 2012 compared to 2011. The increase was
primarily attributable to an increase in headcount related expenses of $126.9 million as we expanded our
field sales organization. We also experienced increases in facilities and related costs of $12.8 million,
marketing and public relations expenses of $7.6 million, consulting services expenses of $6.0 million and
agency commissions of $4.4 million.
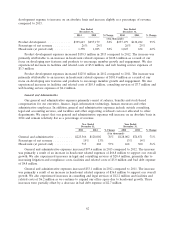
Product Development
Our product development expenses primarily consist of salaries, benefits and stock-based
compensation for our engineers, product managers and developers. In addition, product development
expenses include outside services and consulting, as well as allocated facilities and other supporting
overhead costs. We believe that continued investment in features, software development tools and code
modification is important to achieving our strategic objectives. Consistent with our investment philosophy
for 2014, we expect to continue to invest heavily in product development; therefore, we expect product
61