LinkedIn 2013 Annual Report Download - page 102
Download and view the complete annual report
Please find page 102 of the 2013 LinkedIn annual report below. You can navigate through the pages in the report by either clicking on the pages listed below, or by using the keyword search tool below to find specific information within the annual report.-
 1
1 -
2
-
3
-
4
-
5
-
6
-
7
-
8
-
9
-
10
-
11
-
12
-
13
-
14
-
15
-
16
-
17
-
18
-
19
-
20
-
21
-
22
-
23
-
24
-
25
-
26
-
27
-
28
-
29
-
30
-
31
-
32
-
33
-
34
-
35
-
36
-
37
-
38
-
39
-
40
-
41
-
42
-
43
-
44
-
45
-
46
-
47
-
48
-
49
-
50
-
51
-
52
-
53
-
54
-
55
-
56
-
57
-
58
-
59
-
60
-
61
-
62
-
63
-
64
-
65
-
66
-
67
-
68
-
69
-
70
-
71
-
72
-
73
-
74
-
75
-
76
-
77
-
78
-
79
-
80
-
81
-
82
-
83
-
84
-
85
-
86
-
87
-
88
-
89
-
90
-
91
-
 92
92 -
 93
93 -
 94
94 -
 95
95 -
 96
96 -
 97
97 -
 98
98 -
 99
99 -
 100
100 -
 101
101 -
 102
102 -
 103
103 -
 104
104 -
 105
105 -
 106
106 -
 107
107 -
 108
108 -
 109
109 -
 110
110 -
 111
111 -
 112
112 -
113
-
114
-
115
-
116
 |
 |

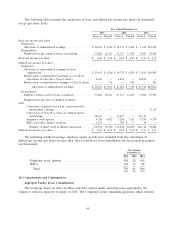
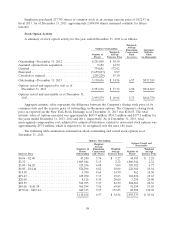
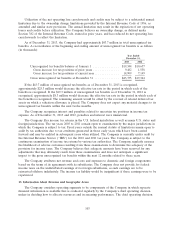
The weighted-average grant date fair value of options granted, excluding assumed acquisition-related
stock options was $89.13, $51.76 and $13.28 for the years ended December 31, 2013, 2012 and 2011,
respectively. The weighted-average grant date fair value of assumed acquisition-related stock options
during the year ended December 31, 2013 was $166.08.
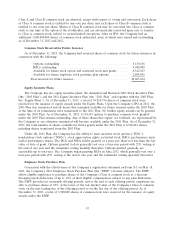
The following table presents the weighted-average assumptions used to estimate the fair value of the
ESPP during the periods presented:
Year Ended
December 31,
2013 2012 2011
Volatility .......................................... 42% 48% 75%
Expected dividend yield ............................... — — —
Risk-free rate ...................................... 0.10% 0.14% 0.06%
Expected term (in years) .............................. 0.50 0.50 0.50
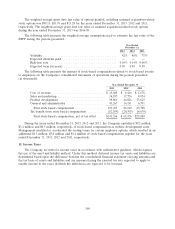
The following table presents the amount of stock-based compensation related to stock-based awards
to employees on the Company’s consolidated statements of operations during the periods presented
(in thousands):
Year Ended December 31,
2013 2012 2011
Cost of revenue ............................. $ 15,600 $ 6,416 $ 1,678
Sales and marketing .......................... 36,187 17,726 8,074
Product development ......................... 98,861 46,026 13,625
General and administrative ..................... 43,267 16,151 6,391
Total stock-based compensation ................ 193,915 86,319 29,768
Tax benefit from stock-based compensation ......... (52,559) (20,395) (4,679)
Total stock-based compensation, net of tax effect . . . $141,356 $ 65,924 $25,089
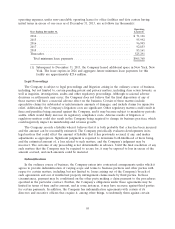
During the years ended December 31, 2013, 2012 and 2011, the Company capitalized $9.2 million,
$3.4 million and $0.5 million, respectively, of stock-based compensation as website development costs.
Management modified or accelerated the vesting terms for certain employee options, which resulted in an
additional $1.3 million, $3.0 million and $1.4 million of stock-based compensation expense for the years
ended December 31, 2013, 2012 and 2011, respectively.
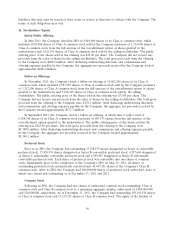
12. Income Taxes
The Company accounts for income taxes in accordance with authoritative guidance, which requires
the use of the asset and liability method. Under this method, deferred income tax assets and liabilities are
determined based upon the difference between the consolidated financial statement carrying amounts and
the tax basis of assets and liabilities and are measured using the enacted tax rate expected to apply to
taxable income in the years in which the differences are expected to be reversed.
100