LinkedIn 2013 Annual Report Download - page 61
Download and view the complete annual report
Please find page 61 of the 2013 LinkedIn annual report below. You can navigate through the pages in the report by either clicking on the pages listed below, or by using the keyword search tool below to find specific information within the annual report.-
 1
1 -
2
-
3
-
4
-
5
-
6
-
7
-
8
-
9
-
10
-
11
-
12
-
13
-
14
-
15
-
16
-
17
-
18
-
19
-
20
-
21
-
22
-
23
-
24
-
25
-
26
-
27
-
28
-
29
-
30
-
31
-
32
-
33
-
34
-
35
-
36
-
37
-
38
-
39
-
40
-
41
-
42
-
43
-
44
-
45
-
46
-
47
-
48
-
49
-
50
-
 51
51 -
 52
52 -
 53
53 -
 54
54 -
 55
55 -
 56
56 -
 57
57 -
 58
58 -
 59
59 -
 60
60 -
 61
61 -
 62
62 -
 63
63 -
 64
64 -
 65
65 -
 66
66 -
 67
67 -
 68
68 -
 69
69 -
 70
70 -
 71
71 -
72
-
73
-
74
-
75
-
76
-
77
-
78
-
79
-
80
-
81
-
82
-
83
-
84
-
85
-
86
-
87
-
88
-
89
-
90
-
91
-
92
-
93
-
94
-
95
-
96
-
97
-
98
-
99
-
100
-
101
-
102
-
103
-
104
-
105
-
106
-
107
-
108
-
109
-
110
-
111
-
112
-
113
-
114
-
115
-
116
 |
 |

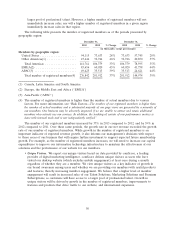
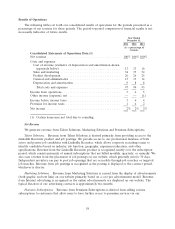
LinkedIn.com website. We offer our members monthly or annual subscriptions. Revenue from Premium
Subscriptions is recognized ratably over the contract period, which is generally one to 12 months.
Year Ended Year Ended
December 31, December 31,
2013 2012 % Change 2012 2011 % Change
($ in thousands)
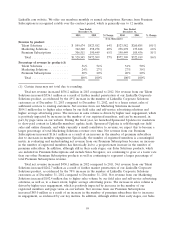
Revenue by product:
Talent Solutions .............. $ 859,674 $523,582 64% $523,582 $260,885 101%
Marketing Solutions ........... 362,360 258,278 40% 258,278 155,848 66%
Premium Subscriptions ......... 306,511 190,449 61% 190,449 105,456 81%
Total ..................... $1,528,545 $972,309 57% $972,309 $522,189 86%
Percentage of revenue by product:(1)
Talent Solutions .............. 56% 54% 54% 50%
Marketing Solutions ........... 24% 27% 27% 30%
Premium Subscriptions ......... 20% 20% 20% 20%
Total ..................... 100% 100% 100% 100%
(1) Certain items may not total due to rounding.
Total net revenue increased $556.2 million in 2013 compared to 2012. Net revenue from our Talent
Solutions increased $336.1 million as a result of further market penetration of our LinkedIn Corporate
Solutions product, as evidenced by the 49% increase in the number of LinkedIn Corporate Solutions
customers as of December 31, 2013 compared to December 31, 2012, and to a lesser extent, sales of
additional services to existing customers. Net revenue from our Marketing Solutions increased
$104.1 million due to higher sales volume by our field sales and self-service advertising solutions and
higher average advertising prices. The increase in sales volume is driven by higher user engagement, which
is positively impacted by increases in the number of our registered members, and can be measured, in
part, by page views on our website. During the fiscal year, we launched Sponsored Updates for marketers
to show paid content in LinkedIn members’ update feeds. Sponsored Updates is sold through our field
sales and online channels, and while currently a small contributor to revenue, we expect this to become a
larger percentage of total Marketing Solutions revenue over time. Net revenue from our Premium
Subscriptions increased $116.1 million as a result of an increase in the number of premium subscribers
due to increases in member engagement. Specifically, the number of registered members is a meaningful
metric in evaluating and understanding net revenue from our Premium Subscriptions because an increase
in the number of registered members has historically led to a proportionate increase in the number of
premium subscribers. In addition, although still in their early stages, our Sales Solutions products, which
are included in Premium Subscriptions and include Sales Navigator, are continuing to grow at a faster rate
than our other Premium Subscription products as well as continuing to represent a larger percentage of
total Premium Subscriptions revenue.
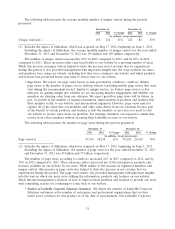
Total net revenue increased $450.1 million in 2012 compared to 2011. Net revenue from our Talent
Solutions increased $262.7 million as a result of further market penetration of our LinkedIn Corporate
Solutions product, as evidenced by the 78% increase in the number of LinkedIn Corporate Solutions
customers as of December 31, 2012 compared to December 31, 2011. Net revenue from our Marketing
Solutions increased $102.4 million due to higher sales volume by our field sales and self-service advertising
solutions, as well as, to a lesser extent, higher average advertising prices. The increase in sales volume is
driven by higher user engagement, which is positively impacted by increases in the number of our
registered members and page views on our website. Net revenue from our Premium Subscriptions
increased $85.0 million as a result of an increase in the number of premium subscribers due to increases
in engagement, as evidenced by our key metrics. In addition, although still in their early stages, our Sales
59