LinkedIn 2013 Annual Report Download - page 88
Download and view the complete annual report
Please find page 88 of the 2013 LinkedIn annual report below. You can navigate through the pages in the report by either clicking on the pages listed below, or by using the keyword search tool below to find specific information within the annual report.-
 1
1 -
2
-
3
-
4
-
5
-
6
-
7
-
8
-
9
-
10
-
11
-
12
-
13
-
14
-
15
-
16
-
17
-
18
-
19
-
20
-
21
-
22
-
23
-
24
-
25
-
26
-
27
-
28
-
29
-
30
-
31
-
32
-
33
-
34
-
35
-
36
-
37
-
38
-
39
-
40
-
41
-
42
-
43
-
44
-
45
-
46
-
47
-
48
-
49
-
50
-
51
-
52
-
53
-
54
-
55
-
56
-
57
-
58
-
59
-
60
-
61
-
62
-
63
-
64
-
65
-
66
-
67
-
68
-
69
-
70
-
71
-
72
-
73
-
74
-
75
-
76
-
77
-
 78
78 -
 79
79 -
 80
80 -
 81
81 -
 82
82 -
 83
83 -
 84
84 -
 85
85 -
 86
86 -
 87
87 -
 88
88 -
 89
89 -
 90
90 -
 91
91 -
 92
92 -
 93
93 -
 94
94 -
 95
95 -
 96
96 -
 97
97 -
 98
98 -
99
-
100
-
101
-
102
-
103
-
104
-
105
-
106
-
107
-
108
-
109
-
110
-
111
-
112
-
113
-
114
-
115
-
116
 |
 |

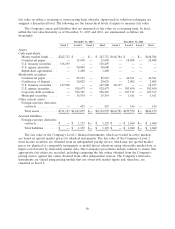
fair value on either a recurring or nonrecurring basis, whereby, inputs used in valuation techniques are
assigned a hierarchical level. The following are the hierarchical levels of inputs to measure fair value:
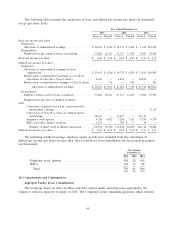
The Company’s assets and liabilities that are measured at fair value on a recurring basis, by level,
within the fair value hierarchy as of December 31, 2013 and 2012, are summarized as follows (in
thousands):
December 31, 2013 December 31, 2012
Level 1 Level 2 Level 3 Total Level 1 Level 2 Level 3 Total
Assets:
Cash equivalents:
Money market funds ..... $242,712 $ — $— $ 242,712 $148,384 $ — $— $148,384
Commercial paper ...... — 15,698 — 15,698 — 18,488 — 18,488
U.S. treasury securities . . . 318,495 — — 318,495 — — — —
U.S. agency securities .... — 50,000 — 50,000 — — — —
Repurchase agreements . . . — 1,400 — 1,400 — — — —
Marketable securities:
Commercial paper ...... — 85,947 — 85,947 — 46,361 — 46,361
Certificates of deposit .... — 20,025 — 20,025 — 2,005 — 2,005
U.S. treasury securities . . . 149,908 — — 149,908 18,197 — — 18,197
U.S. agency securities .... — 928,473 — 928,473 — 303,450 — 303,450
Corporate debt securities . — 326,345 — 326,345 — 107,517 — 107,517
Municipal securities ..... — 15,514 — 15,514 — 1,611 — 1,611
Other current assets:
Foreign currency derivative
contracts ............ — 453 — 453 — 146 — 146
Total assets .......... $711,115 $1,443,855 $— $2,154,970 $166,581 $479,578 $— $646,159
Accrued liabilities:
Foreign currency derivative
contracts ............ $ — $ 1,129 $— $ 1,129 $ — $ 1,040 $— $ 1,040
Total liabilities ........ $ — $ 1,129 $— $ 1,129 $ — $ 1,040 $— $ 1,040
The fair value of the Company’s Level 1 financial instruments, which are traded in active markets,
are based on quoted market prices for identical instruments. The fair value of the Company’s Level 2
fixed income securities are obtained from an independent pricing service, which may use quoted market
prices for identical or comparable instruments or model driven valuations using observable market data or
inputs corroborated by observable market data. The Company’s procedures include controls to ensure that
appropriate fair values are recorded, including comparing the fair values obtained from the Company’s
pricing service against fair values obtained from other independent sources. The Company’s derivative
instruments are valued using pricing models that use observable market inputs and, therefore, are
classified as Level 2.
86