LG 2003 Annual Report Download - page 56
Download and view the complete annual report
Please find page 56 of the 2003 LG annual report below. You can navigate through the pages in the report by either clicking on the pages listed below, or by using the keyword search tool below to find specific information within the annual report.-
 1
1 -
2
-
3
-
4
-
5
-
6
-
7
-
8
-
9
-
10
-
11
-
12
-
13
-
14
-
15
-
16
-
17
-
18
-
19
-
20
-
21
-
22
-
23
-
24
-
25
-
26
-
27
-
28
-
29
-
30
-
31
-
32
-
33
-
34
-
35
-
36
-
37
-
38
-
39
-
40
-
41
-
42
-
43
-
44
-
45
-
 46
46 -
 47
47 -
 48
48 -
 49
49 -
 50
50 -
 51
51 -
 52
52 -
 53
53 -
 54
54 -
 55
55 -
 56
56 -
 57
57 -
 58
58 -
 59
59 -
 60
60 -
 61
61 -
 62
62 -
 63
63 -
 64
64 -
 65
65 -
 66
66 -
67
-
68
-
69
-
70
-
71
-
72
-
73
-
74
-
75
-
76
-
77
-
78
-
79
-
80
-
81
-
82
-
83
-
84
-
85
-
86
-
87
-
88
-
89
-
90
-
91
-
92
-
93
-
94
-
95
-
96
-
97
-
98
-
99
-
100
-
101
-
102
-
103
-
104
-
105
-
106
-
107
-
108
-
109
-
110
-
111
-
112
-
113
-
114
 |
 |

56
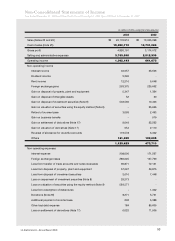
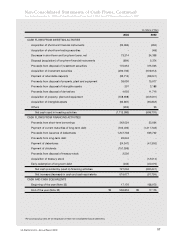
Non-Consolidated Statements of Cash Flows
Year Ended December 31, 2003 and Nine-Month Period from April 1, 2002 (Spin-Off Date) to December 31, 2002
(in millions of Won)
2003 2002
CASH FLOWS FROM OPERATING ACTIVITIES
Net income ₩662,824 ₩277,716
Adjustments to reconcile net income to net cash provided by operating activities
Depreciation and amortization 617,894 447,809
Amortization of discounts on debentures 17,981 3,031
Provision for severance benefits 135,750 102,618
Loss from transfer of trade accounts and notes receivable 96,871 72,121
Bad debt expense 31,273 85,719
Loss (gain) on foreign currency translation, net 25,640 (29,283)
Gain from disposal of investment securities, net (500,920) (2,955)
Loss on impairment of investment securities 29,273 -
Loss from disposal of property, plant and equipment, net 61,750 58,451
Loss (gain) on valuation of securities using the equity method 584,571 (26,666)
Loss (gain) on valuation of derivatives, net 9,206 (1,576)
Gain on settlement of derivatives, net (3,027) (11,716)
Provision for product warranty 4,782 38,979
Others (104,473) (3,774)
1,006,571 732,758
Changes in operating assets and liabilities
Decrease (increase) in trade accounts and notes receivable 59,626 (67,074)
Increase in other accounts receivable (213,827) (33,711)
Increase in accrued income (30,508) (61,431)
Decrease (increase) in advances 139,003 (44,012)
Decrease (increase) in other current assets 21 (671)
Increase in inventories (308,259) (325,609)
Decrease (increase) in prepaid expenses 10,277 (19,112)
Increase in deferred income tax assets (7,354) (47,297)
Increase (decrease) in trade accounts and notes payable (170,511) 394,742
Increase in other accounts payable 39,633 593,967
Increase (decrease) in accrued expenses 27,209 (585)
Increase (decrease) in withholdings (14,385) 13,653
Increase (decrease) in advances from customers (80,938) 57,031
Increase (decrease) in income taxes payable (107,848) 156,609
Payment of severance benefits (81,297) (86,363)
Increase in severance insurance deposits (27,341) (36,170)
Decrease in contributions to the National Pension Fund 2,667 3,048
Others - (265)
(763,832) 496,750
Net cash provided by operating activities 905,563 1,507,224