LG 2003 Annual Report Download - page 101
Download and view the complete annual report
Please find page 101 of the 2003 LG annual report below. You can navigate through the pages in the report by either clicking on the pages listed below, or by using the keyword search tool below to find specific information within the annual report.-
 1
1 -
2
-
3
-
4
-
5
-
6
-
7
-
8
-
9
-
10
-
11
-
12
-
13
-
14
-
15
-
16
-
17
-
18
-
19
-
20
-
21
-
22
-
23
-
24
-
25
-
26
-
27
-
28
-
29
-
30
-
31
-
32
-
33
-
34
-
35
-
36
-
37
-
38
-
39
-
40
-
41
-
42
-
43
-
44
-
45
-
46
-
47
-
48
-
49
-
50
-
51
-
52
-
53
-
54
-
55
-
56
-
57
-
58
-
59
-
60
-
61
-
62
-
63
-
64
-
65
-
66
-
67
-
68
-
69
-
70
-
71
-
72
-
73
-
74
-
75
-
76
-
77
-
78
-
79
-
80
-
81
-
82
-
83
-
84
-
85
-
86
-
87
-
88
-
89
-
90
-
 91
91 -
 92
92 -
 93
93 -
 94
94 -
 95
95 -
 96
96 -
 97
97 -
 98
98 -
 99
99 -
 100
100 -
 101
101 -
 102
102 -
 103
103 -
 104
104 -
 105
105 -
 106
106 -
 107
107 -
 108
108 -
 109
109 -
 110
110 -
 111
111 -
112
-
113
-
114
 |
 |

LG Electronics Inc._Annual Report 2003 101
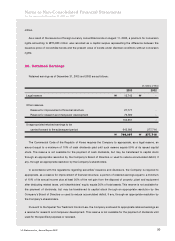
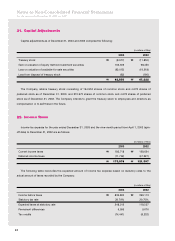
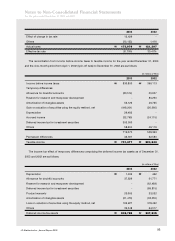
Notes to Non-Consolidated Financial Statements
For the years ended December 31, 2003 and 2002
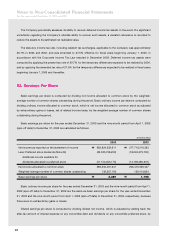
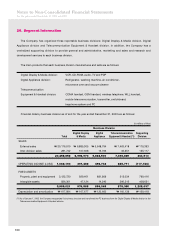
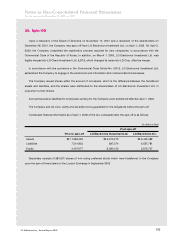
Financial data by business division as of and for the nine-month period ended December 31, 2002 are as
follows:
(in millions of Won)
Business Division
Digital Display Digital Telecommunication Supporting
Total & Media Appliance Equipment & Handset Division
SALES
External sales ₩13,905,098 ₩5,931,025 ₩4,356,961 ₩3,481,795 ₩135,317
Inter-division sales 175,236 61,254 16,917 34,371 62,694
14,080,334 5,992,279 4,373,878 3,516,166 198,011
OPERATING INCOME (LOSS) 661,673 141,082 385,164 208,496 (73,069)
FIXED ASSETS
Property, plant and equipment 2,893,372 827,438 849,042 440,594 776,298
Intangible assets 972,467 71,449 13,343 413,443 474,232
3,865,839 898,887 862,385 854,037 1,250,530
Depreciation and amortization ₩447,809 ₩130,949 ₩87,791 ₩118,707 ₩110,362
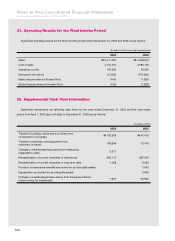
Financial data by geographic area for the year ended December 31, 2003 are as follows:
(in millions of Won)
Central &
North South Central
Total Domestic America Europe America Asia Asia Oceania Others
Sales
External sales ₩20,176,910 ₩4,793,702 ₩5,760,389 ₩1,787,823 ₩413,315 ₩942,978 ₩4,894,076 ₩460,057 ₩1,124,570
Ratio (%) 100% 24% 28% 9% 2% 5% 24% 2% 6%
Inter-division sales 281,742 281,742 - - - - - - -
₩20,458,652 ₩5,075,444 ₩5,760,389 ₩1,787,823 ₩413,315 ₩942,978 ₩4,894,076 ₩460,057 ₩1,124,570
Financial data by geographic area for the nine-month period ended December 31, 2002 are as follows:
(in millions of Won)
Central &
North South Central
Total Domestic America Europe America Asia Asia Oceania Others
Sales
External sales ₩13,905,098 ₩5,054,623 ₩3,146,157 ₩1,361,473 ₩257,346 ₩552,951 ₩3,102,253 ₩254,874 ₩175,421
Ratio (%) 100% 36% 23% 10% 2% 4% 22% 2% 1%
Inter-division sales 175,236 175,236 - - - - - - -
₩14,080,334 ₩5,229,859 ₩3,146,157 ₩1,361,473 ₩257,346 ₩552,951 ₩3,102,253 ₩254,874 ₩175,421