LG 2003 Annual Report Download - page 40
Download and view the complete annual report
Please find page 40 of the 2003 LG annual report below. You can navigate through the pages in the report by either clicking on the pages listed below, or by using the keyword search tool below to find specific information within the annual report.-
 1
1 -
2
-
3
-
4
-
5
-
6
-
7
-
8
-
9
-
10
-
11
-
12
-
13
-
14
-
15
-
16
-
17
-
18
-
19
-
20
-
21
-
22
-
23
-
24
-
25
-
26
-
27
-
28
-
29
-
 30
30 -
 31
31 -
 32
32 -
 33
33 -
 34
34 -
 35
35 -
 36
36 -
 37
37 -
 38
38 -
 39
39 -
 40
40 -
 41
41 -
 42
42 -
 43
43 -
 44
44 -
 45
45 -
 46
46 -
 47
47 -
 48
48 -
 49
49 -
 50
50 -
51
-
52
-
53
-
54
-
55
-
56
-
57
-
58
-
59
-
60
-
61
-
62
-
63
-
64
-
65
-
66
-
67
-
68
-
69
-
70
-
71
-
72
-
73
-
74
-
75
-
76
-
77
-
78
-
79
-
80
-
81
-
82
-
83
-
84
-
85
-
86
-
87
-
88
-
89
-
90
-
91
-
92
-
93
-
94
-
95
-
96
-
97
-
98
-
99
-
100
-
101
-
102
-
103
-
104
-
105
-
106
-
107
-
108
-
109
-
110
-
111
-
112
-
113
-
114
 |
 |
40
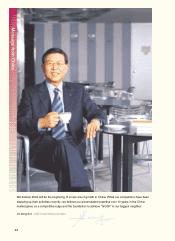
|||||||Message from CFO
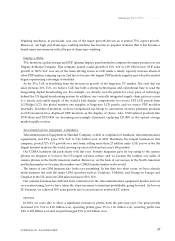
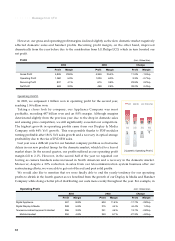
INVESTMENT
We invested a total of 1.85 trillion won in 2003 or 9% of total sales. Of this amount, investment earmarked
for our 2nd PDP line was 830 billion won, and R&D expenditure was 1.02 trillion won or 5% of sales.
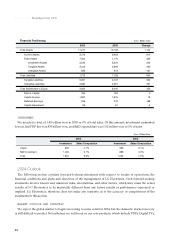
2004 Outlook
The following section contains forward-looking statements with respect to results of operations, the
financial conditions and plans and objectives of the management of LG Electronics. Such forward-looking
statements involve known and unknown risks, uncertainties, and other factors, which may cause the actual
results of LG Electronics to be materially different from any future results or performance expressed or
implied. LG Electronics, therefore, does not make any warranty as to the accuracy or completeness of the
statements in this section.
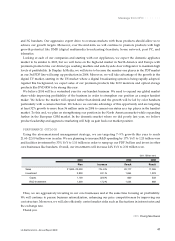
MARKET OUTLOOK AND STRATEGY
We expect the global market to begin recovering to some extent in 2004, but the domestic market recovery
is still difficult to predict. Nevertheless, we will focus on our core products, which include PDPs, Digital TVs,
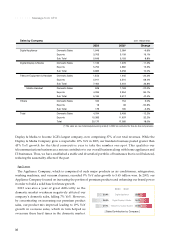
Financial Positioning (Unit : Billion won)
2003 2002 Change
Total Assets 11,277 10,133 1,144
Current Assets 3,773 2,963 810
Fixed Assets 7,505 7,170 335
Investment Assets 3,546 3,304 242
Tangible Assets 3,123 2,893 230
Intangible Assets 836 973 -137
Total Liabilities 7,773 7,128 645
Tangible Liabilities 5,091 4,737 354
Intangible Liabilities 2,682 2,391 291
Total Shareholder’s Equity 3,505 3,005 450
Paid-in Capital 784 784 0
Capital Surplus 1,892 1,876 16
Retained Earnings 766 278 488
Capital Adjustment 63 67 -4
(Unit : Billion Won)
2003 2002
Investment Sales Composition Investment Sales Composition
Capex 830 4.1% 533 3.1%
R&D Investment 1,024 5.1% 689 4.0%
Total 1,854 9.2% 1,223 7.2%