LG 2003 Annual Report Download - page 39
Download and view the complete annual report
Please find page 39 of the 2003 LG annual report below. You can navigate through the pages in the report by either clicking on the pages listed below, or by using the keyword search tool below to find specific information within the annual report.-
 1
1 -
2
-
3
-
4
-
5
-
6
-
7
-
8
-
9
-
10
-
11
-
12
-
13
-
14
-
15
-
16
-
17
-
18
-
19
-
20
-
21
-
22
-
23
-
24
-
25
-
26
-
27
-
28
-
 29
29 -
 30
30 -
 31
31 -
 32
32 -
 33
33 -
 34
34 -
 35
35 -
 36
36 -
 37
37 -
 38
38 -
 39
39 -
 40
40 -
 41
41 -
 42
42 -
 43
43 -
 44
44 -
 45
45 -
 46
46 -
 47
47 -
 48
48 -
 49
49 -
50
-
51
-
52
-
53
-
54
-
55
-
56
-
57
-
58
-
59
-
60
-
61
-
62
-
63
-
64
-
65
-
66
-
67
-
68
-
69
-
70
-
71
-
72
-
73
-
74
-
75
-
76
-
77
-
78
-
79
-
80
-
81
-
82
-
83
-
84
-
85
-
86
-
87
-
88
-
89
-
90
-
91
-
92
-
93
-
94
-
95
-
96
-
97
-
98
-
99
-
100
-
101
-
102
-
103
-
104
-
105
-
106
-
107
-
108
-
109
-
110
-
111
-
112
-
113
-
114
 |
 |

LG Electronics Inc._Annual Report 2003 39
Message from CFO |||||||
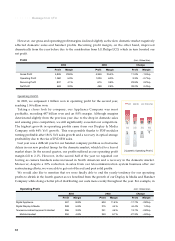
the 4th quarter of 2002, operating profits shrunk 78% from its previous quarter to 42 billion won, but in 2003
4th quarter profits increased 7% QoQ to 198 billion won.
Recurring profit
Our recurring profit rose 24% YoY to 837 billion won. In 2003, there were a variety of external factors that
contributed to overall profit growth. First, we will explain our accounting net equity loss of 585 billion won
and our adjusted equity gain of 35 billion won.
LG.Philips LCD contributed 540 billion won through equity method accounting as it became the largest
producer of TFT LCD panels in the world by setting up a second 5th Generation LCD facility while TFT LCD
panel prices rose significantly. However, we incurred an equity method loss of 1,032 billion won from our
CRT joint venture, LG.Philips Displays, in addition to a 93 billion won loss from our overseas subsidiary. The
huge losses from LG.Philips Display were due mainly to the rise of LCDs and the contraction of the CRT
market and losses from asset revaluation.
However, the 585 billion won equity method loss does not clearly paint the whole picture and one should
considering the other non-operating gains that more than offset the losses. Specifically, we recorded a gain of
501 billion won when we transferred our shares of LG.Philips Displays to our overseas subsidiary, and a
provision made earlier of 119 billion won was brought back down. Thus, our adjusted equity method gains
were in fact a positive 35 billion won.
Our interest payments decreased 34 billion won or 14% to 209 billion won. Despite an increase in debt,
thanks to a zero coupon CB issuance and significantly lower interest rates from a higher portion of foreign
debt (25.3% of total debt in 2002 to 32.8% in 2003), we were able to bring down our average cost of debt.
Net Profit
Our net profit increased 33% to 663 billion won. The main reason for the significant improvement in
earnings, as we mentioned earlier, was the increase in recurring profit, and the second was our effective tax
rate falling to 21% from 26% the year before.
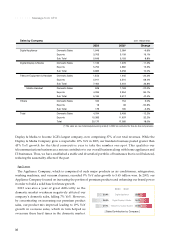
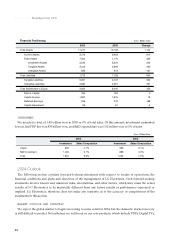
BALANCE SHEET
Despite an increase in debt, our financial structure improved as the rise in shareholders’ equity from strong
earnings helped bring down our liabilities-to-equity ratio by 15 percentage points to 222% from 237%
previous year, while our net debt-to-equity ratio fell to 93% from 96%.
At the end of 2003, our total assets were 11.3 trillion won, 1.1 trillion won more than the previous year. The
main reasons for the increase in assets include an increase in cash of 520 billion won to 537 billion won, a rise
in the value of LG.Philips LCD, and greater facility investment that raised our tangible assets.
Our liabilities increased by 645 billion won to 7.77 trillion won, driven mainly by our interest bearing debt
rising 891 billion won to 3.79 trillion won, but most of it is still reflected in our cash increase of 520 billion
won. Thus, as we mentioned above, we are still financially healthier as our liabilities-to-equity and net
debt-to-equity ratios have fallen to 222% and 93% respectively.
As retained earnings increased on the back of our net profits, our total capital base increased 500 billion
won to 3.50 trillion won. Finally, our share price rose 42% from 41,300 won per share at the end of 2002 to
58,600 won per share at the end of 2003.