LG 2003 Annual Report Download - page 100
Download and view the complete annual report
Please find page 100 of the 2003 LG annual report below. You can navigate through the pages in the report by either clicking on the pages listed below, or by using the keyword search tool below to find specific information within the annual report.-
 1
1 -
2
-
3
-
4
-
5
-
6
-
7
-
8
-
9
-
10
-
11
-
12
-
13
-
14
-
15
-
16
-
17
-
18
-
19
-
20
-
21
-
22
-
23
-
24
-
25
-
26
-
27
-
28
-
29
-
30
-
31
-
32
-
33
-
34
-
35
-
36
-
37
-
38
-
39
-
40
-
41
-
42
-
43
-
44
-
45
-
46
-
47
-
48
-
49
-
50
-
51
-
52
-
53
-
54
-
55
-
56
-
57
-
58
-
59
-
60
-
61
-
62
-
63
-
64
-
65
-
66
-
67
-
68
-
69
-
70
-
71
-
72
-
73
-
74
-
75
-
76
-
77
-
78
-
79
-
80
-
81
-
82
-
83
-
84
-
85
-
86
-
87
-
88
-
89
-
 90
90 -
 91
91 -
 92
92 -
 93
93 -
 94
94 -
 95
95 -
 96
96 -
 97
97 -
 98
98 -
 99
99 -
 100
100 -
 101
101 -
 102
102 -
 103
103 -
 104
104 -
 105
105 -
 106
106 -
 107
107 -
 108
108 -
 109
109 -
 110
110 -
111
-
112
-
113
-
114
 |
 |

100
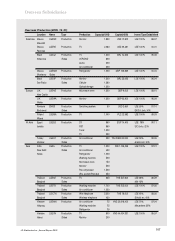
Notes to Non-Consolidated Financial Statements
For the years ended December 31, 2003 and 2002
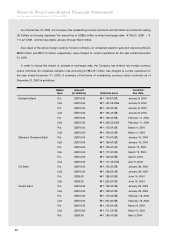
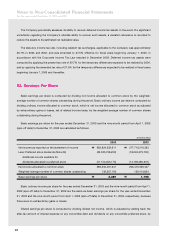
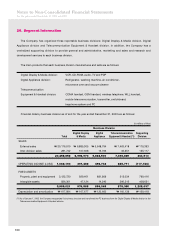
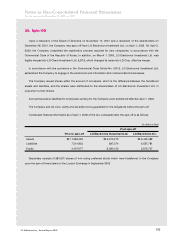
26. Segment Information
The Company has organized three reportable business divisions: Digital Display & Media division, Digital
Appliance division and Telecommunication Equipment & Handset division. In addition, the Company has a
centralized supporting division to provide general and administrative, marketing and sales and research and
development services to each business division.
The main products that each business division manufactures and sells are as follows:
Digital Display & Media division: VCR, CD-ROM, audio, TV and PDP
Digital Appliance division: Refrigerator, washing machine, air conditioner,
microwave oven and vacuum cleaner
Telecommunication
Equipment & Handset division: CDMA handset, GSM handset, wireless telephone, WLL handset,
mobile telecommunication, transmitter, switchboard,
keyphone system and PC
Financial data by business division as of and for the year ended December 31, 2003 are as follows:
(in millions of Won)
Business Division
Digital Display Digital Telecommunication Supporting
Total & Media Appliance
Equipment & Handset (*1)
Division
SALES
External sales ₩20,176,910 ₩6,885,305 ₩5,648,794 ₩7,463,418 ₩179,393
Inter-division sales 281,742 107,668 15,706 33,251 125,117
20,458,652 6,992,973 5,664,500 7,496,669 304,510
OPERATING INCOME (LOSS) 1,062,193 397,482 496,743 285,711 (117,743)
FIXED ASSETS
Property, plant and equipment 3,122,720 929,461 881,809 512,034 799,416
Intangible assets 836,301 47,124 14,240 366,316 408,621
3,959,021 976,585 896,049 878,350 1,208,037
Depreciation and amortization ₩617,894 ₩167,677 ₩120,660 ₩160,139 ₩169,418
(*1) As of January 1, 2003, the Company reorganized its business structure and transferred the PC business from the Digital Display & Media division to the
Telecommunication Equipment & Handset division.