LG 2003 Annual Report Download - page 4
Download and view the complete annual report
Please find page 4 of the 2003 LG annual report below. You can navigate through the pages in the report by either clicking on the pages listed below, or by using the keyword search tool below to find specific information within the annual report.-
 1
1 -
 2
2 -
 3
3 -
 4
4 -
 5
5 -
 6
6 -
 7
7 -
 8
8 -
 9
9 -
 10
10 -
 11
11 -
 12
12 -
 13
13 -
 14
14 -
 15
15 -
16
-
17
-
18
-
19
-
20
-
21
-
22
-
23
-
24
-
25
-
26
-
27
-
28
-
29
-
30
-
31
-
32
-
33
-
34
-
35
-
36
-
37
-
38
-
39
-
40
-
41
-
42
-
43
-
44
-
45
-
46
-
47
-
48
-
49
-
50
-
51
-
52
-
53
-
54
-
55
-
56
-
57
-
58
-
59
-
60
-
61
-
62
-
63
-
64
-
65
-
66
-
67
-
68
-
69
-
70
-
71
-
72
-
73
-
74
-
75
-
76
-
77
-
78
-
79
-
80
-
81
-
82
-
83
-
84
-
85
-
86
-
87
-
88
-
89
-
90
-
91
-
92
-
93
-
94
-
95
-
96
-
97
-
98
-
99
-
100
-
101
-
102
-
103
-
104
-
105
-
106
-
107
-
108
-
109
-
110
-
111
-
112
-
113
-
114
 |
 |
4
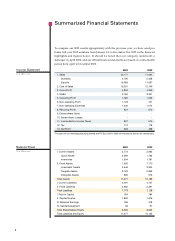
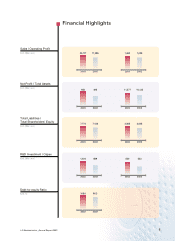
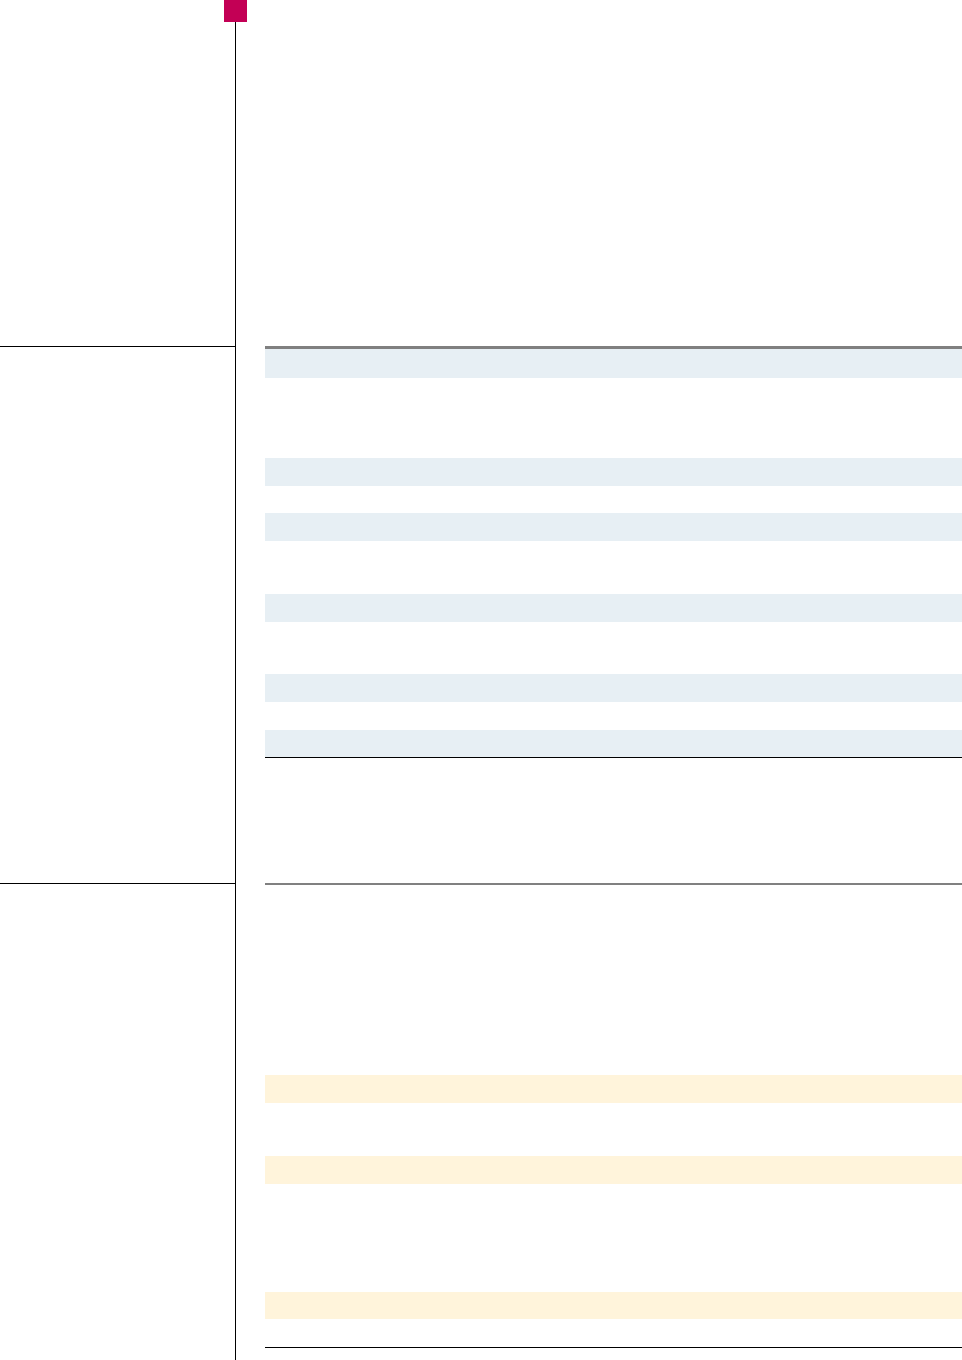
2003 2002
1. Sales 20,177 17,095
Domestic 4,794 5,458
Exports 15,383 11,637
2. Cost of Sales 15,351 12,746
3. Gross Profit 4,826 4,349
4. SG&A 3,764 3,321
5. Operating Profit 1,062 1,029
6. Non-operating Profit 1,123 721
7. Non-operating Expenses 1,349 1,074
8. Recurring Profit 837 675
9. Extraordinary Gains - -
10. Extraordinary Losses - -
11. Income Before Income Taxes 837 675
12. Tax 174 178
13. Net Profit 663 498
*The sales on raw materials(outsourcing related) and PC Buy & Sell in 2002 are excluded for like-for-like comparisons.
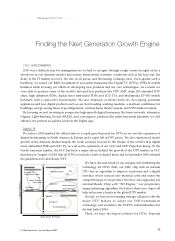
To compare our 2003 results appropriately with the previous year, we have used pro
forma full year 2002 numbers from January 1st to December 31st 2002 in the financial
highlights and figures below. It should be noted that our company underwent a
demerger in April 2002, and our official financial statements are based on a nine-month
period from April to December 2002.
Income Statement
(Unit, Billion won)
2003 2002
I. Current Assets 3,773 2,963
Quick Assets 2,269 1,782
Inventories 1,504 1,181
II. Fixed Assets 7,505 7,170
Investment Assets 3,546 3,304
Tangible Assets 3,123 2,893
Intangible Assets 836 973
Total Assets 11,277 10,133
I. Current Liabilities 5,091 4,737
II. Fixed Liabilities 2,682 2,391
Total Liabilities 7,773 7,128
I. Paid-in Capital 784 784
II. Capital Surplus 1,892 1,876
III. Retained Earnings 766 278
IV. Capital Adjustment 63 67
Total Shareholders’ Equity 3,505 3,005
Total Liabilities and Equity 11,277 10,133
Balance Sheet
(Unit, Billion won)
Summarized Financial Statements