LG 2003 Annual Report Download - page 38
Download and view the complete annual report
Please find page 38 of the 2003 LG annual report below. You can navigate through the pages in the report by either clicking on the pages listed below, or by using the keyword search tool below to find specific information within the annual report.-
 1
1 -
2
-
3
-
4
-
5
-
6
-
7
-
8
-
9
-
10
-
11
-
12
-
13
-
14
-
15
-
16
-
17
-
18
-
19
-
20
-
21
-
22
-
23
-
24
-
25
-
26
-
27
-
 28
28 -
 29
29 -
 30
30 -
 31
31 -
 32
32 -
 33
33 -
 34
34 -
 35
35 -
 36
36 -
 37
37 -
 38
38 -
 39
39 -
 40
40 -
 41
41 -
 42
42 -
 43
43 -
 44
44 -
 45
45 -
 46
46 -
 47
47 -
 48
48 -
49
-
50
-
51
-
52
-
53
-
54
-
55
-
56
-
57
-
58
-
59
-
60
-
61
-
62
-
63
-
64
-
65
-
66
-
67
-
68
-
69
-
70
-
71
-
72
-
73
-
74
-
75
-
76
-
77
-
78
-
79
-
80
-
81
-
82
-
83
-
84
-
85
-
86
-
87
-
88
-
89
-
90
-
91
-
92
-
93
-
94
-
95
-
96
-
97
-
98
-
99
-
100
-
101
-
102
-
103
-
104
-
105
-
106
-
107
-
108
-
109
-
110
-
111
-
112
-
113
-
114
 |
 |
38
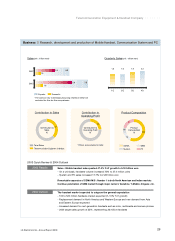
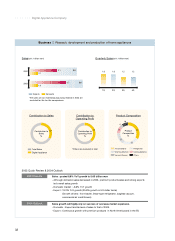
|||||||Message from CFO
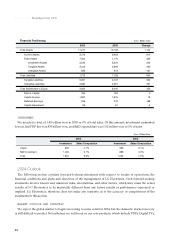
However, our gross and operating profit margins declined slightly as the slow domestic market negatively
affected domestic sales and handset profits. Recurring profit margin, on the other hand, improved
dramatically from the year before due to the contribution from LG.Philips LCD, which in turn boosted our
net profit.
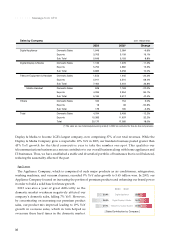
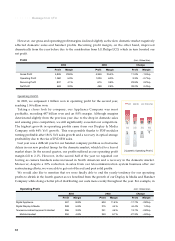
Operating Profit
In 2003, we surpassed 1 trillion won in operating profit for the second year,
reaching 1.06 trillion won.
Taking a closer look by company, our Appliance Company was most
profitable, recording 497 billion won and an 8.8% margin. Although margins
deteriorated slightly from the previous year due to the drop in domestic sales
and ensuing price competition, we still significantly exceeded our competitors.
The highest growth in operating profits came from our Display & Media
Company with 44% YoY growth. This was possible thanks to PDP modules
turning profitable after 186% YoY sales growth and a recovery in optical storage
profitability due to the rise of DVD-RW sales.
Last year was a difficult year for our handset company profits as we had some
delays in our new product lineup for the domestic market, which led to a loss of
market share. In the second quarter, our profits suffered as our operating profit
margin fell to 2.1%. However, in the second half of the year we regained our
footing as camera handsets sales increased in North American and a recovery in the domestic market.
Moreover, despite a 20% reduction in sales from our telecommunication system business after our
restructuring efforts, we were able to get out of the red and post solid profits.
We would also like to mention that we were finally able to end the yearly tendency for our operating
profits to shrink in the fourth quarter as we benefited from the growth of our Display & Media and Handset
Company while doing a better job of distributing our costs more evenly throughout the year. For example, in
Operating Profit (Unit : Billion Won)
2003 2002 Change
Profit Margin Profit Margin Profit Margin
Digital Appliance 497 8.8% 604 11.6% -17.7% -2.8%p
Digital Display & Media 398 5.8% 275 4.4% 44.4% 1.4%p
Telecommunication Equipment & Handset
286 3.8% 251 4.6% 13.7% -0.8%p
Mobile Handset 250 4.8% 343 9.7% -27.3% -4.9%p
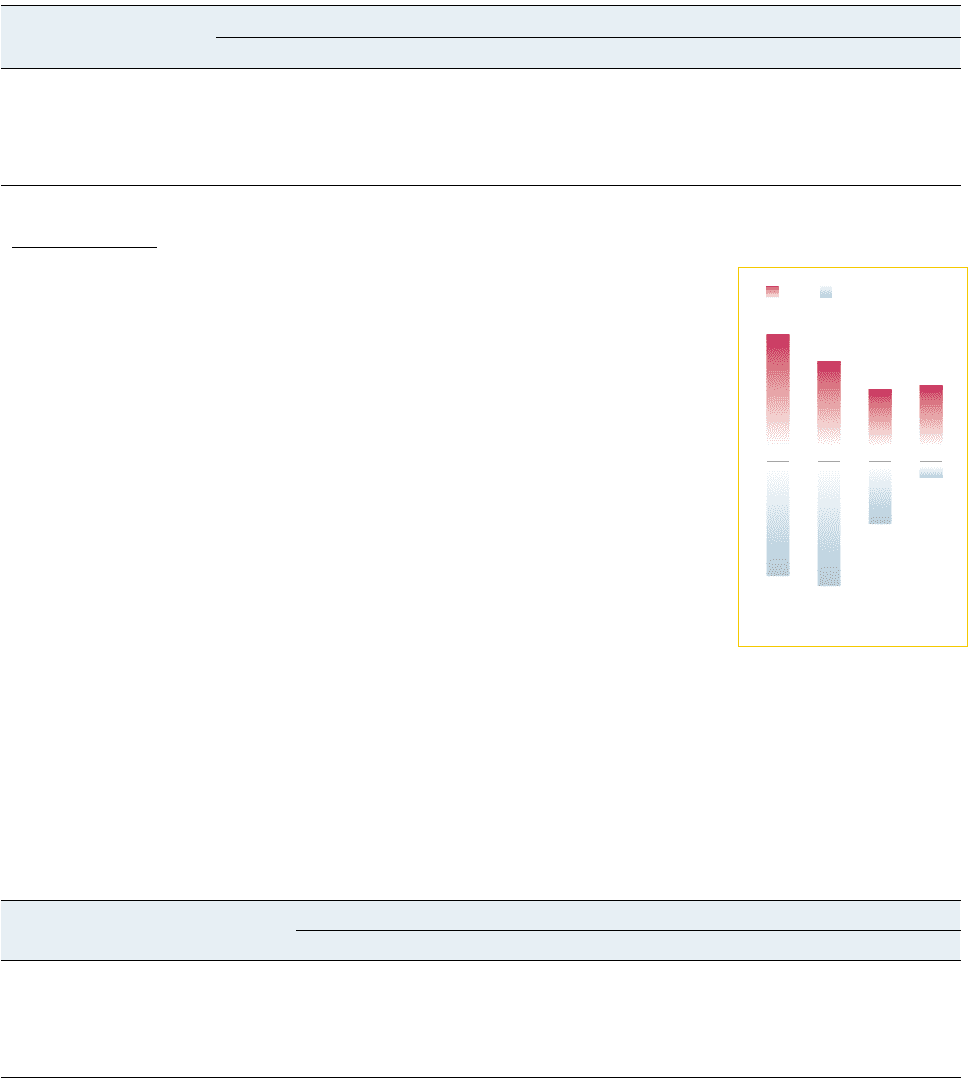
[ Quarterly Operating Profit ]
2003 2002
367 417
262
185
198
429
190
42
1Q 2Q 3Q 4Q
(Unit : Billion Won)
Profit (Unit : Billion Won)
2003 2002 Change
Profit Margin Profit Margin Profit Margin
Gross Profit 4,826 23.9% 4,349 25.4% 11.0% -1.5%p
Operating Profit 1,062 5.3% 1,029 6.0% 3.3% -0.7%p
Recurring Profit 837 4.1% 675 3.9% 23.9% 0.2%p
Net Profit 663 3.3% 498 2.9% 33.2% 0.4%p