LG 2003 Annual Report Download - page 25
Download and view the complete annual report
Please find page 25 of the 2003 LG annual report below. You can navigate through the pages in the report by either clicking on the pages listed below, or by using the keyword search tool below to find specific information within the annual report.-
 1
1 -
2
-
3
-
4
-
5
-
6
-
7
-
8
-
9
-
10
-
11
-
12
-
13
-
14
-
 15
15 -
 16
16 -
 17
17 -
 18
18 -
 19
19 -
 20
20 -
 21
21 -
 22
22 -
 23
23 -
 24
24 -
 25
25 -
 26
26 -
 27
27 -
 28
28 -
 29
29 -
 30
30 -
 31
31 -
 32
32 -
 33
33 -
 34
34 -
 35
35 -
36
-
37
-
38
-
39
-
40
-
41
-
42
-
43
-
44
-
45
-
46
-
47
-
48
-
49
-
50
-
51
-
52
-
53
-
54
-
55
-
56
-
57
-
58
-
59
-
60
-
61
-
62
-
63
-
64
-
65
-
66
-
67
-
68
-
69
-
70
-
71
-
72
-
73
-
74
-
75
-
76
-
77
-
78
-
79
-
80
-
81
-
82
-
83
-
84
-
85
-
86
-
87
-
88
-
89
-
90
-
91
-
92
-
93
-
94
-
95
-
96
-
97
-
98
-
99
-
100
-
101
-
102
-
103
-
104
-
105
-
106
-
107
-
108
-
109
-
110
-
111
-
112
-
113
-
114
 |
 |

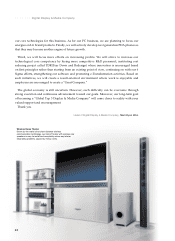
제품구성
LG Electronics Inc._Annual Report 2003 25
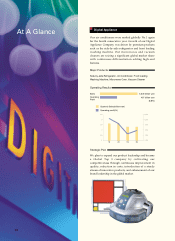
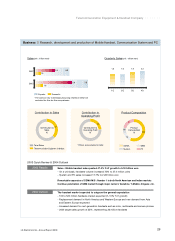
Sales(unit : trillion won) Quarterly Sales(unit : trillion won)
2002*
Sales : 10.0% YoY growth to 6.89 trillion won
- Despite SARS epidemic, War in Iraq, and the weak domestic economy, sales grew by
export expansion and well performed high-end products
- Growth was led by PDPs and DTVs as well as DVD writers
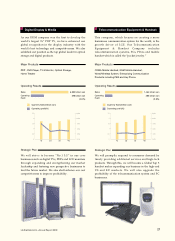
2003 Results
While the IT industry and the global economy are expected to recover, severe price
competition in digital products and slow domestic economy are risks
- PDP : start of 3rd mass production line and planning of 4th line
- Digital TV & LCD monitors : strengthening of brand in the North American market
- Optical Storage : sales expansion of DVD writers and timely release of new products
2004 Outlook
2003
1.1
5.8 6.9
2003 Quick Review & 2004 Outlook
Contribution to
Sales
%
1Q
1.7
2Q
1.5
3Q
1.9
4Q
1.7
Product Composition
34
16
20
20
8
2
Total Sales
Digital Display & Media
Exports Domestic
*The sales on raw materials(outsourcing related) in 2002 are
excluded for like-for-like comparisons.
Contribution to Sales Contribution to
Operating Profit
*Others are excluded in total
34
34
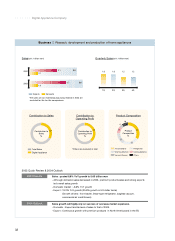
Business Research, development and production of Multimedia and Display related products
Product
Composition
%
Digital Display & Media Company |||||||
Contribution to
Operating Profit
%
5.0 6.3
1.3
TV A/V
Optical Storage
Monitor PDP Others