LG 2003 Annual Report Download - page 29
Download and view the complete annual report
Please find page 29 of the 2003 LG annual report below. You can navigate through the pages in the report by either clicking on the pages listed below, or by using the keyword search tool below to find specific information within the annual report.-
 1
1 -
2
-
3
-
4
-
5
-
6
-
7
-
8
-
9
-
10
-
11
-
12
-
13
-
14
-
15
-
16
-
17
-
18
-
 19
19 -
 20
20 -
 21
21 -
 22
22 -
 23
23 -
 24
24 -
 25
25 -
 26
26 -
 27
27 -
 28
28 -
 29
29 -
 30
30 -
 31
31 -
 32
32 -
 33
33 -
 34
34 -
 35
35 -
 36
36 -
 37
37 -
 38
38 -
 39
39 -
40
-
41
-
42
-
43
-
44
-
45
-
46
-
47
-
48
-
49
-
50
-
51
-
52
-
53
-
54
-
55
-
56
-
57
-
58
-
59
-
60
-
61
-
62
-
63
-
64
-
65
-
66
-
67
-
68
-
69
-
70
-
71
-
72
-
73
-
74
-
75
-
76
-
77
-
78
-
79
-
80
-
81
-
82
-
83
-
84
-
85
-
86
-
87
-
88
-
89
-
90
-
91
-
92
-
93
-
94
-
95
-
96
-
97
-
98
-
99
-
100
-
101
-
102
-
103
-
104
-
105
-
106
-
107
-
108
-
109
-
110
-
111
-
112
-
113
-
114
 |
 |

LG Electronics Inc._Annual Report 2003 29
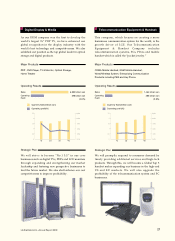
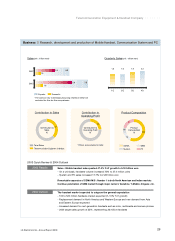
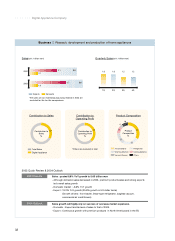
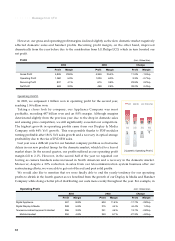
Sales(unit : trillion won) Quarterly Sales(unit : trillion won)
2002*
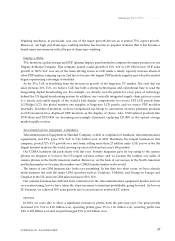
Sales : Mobile handset sales posted 47.4% YoY growth to 5.18 trillion won
- On a unit basis, handsets volume increased 72% to 27.4 million units
- System and PC sales increased 17.7% to 2.28 trillion won
Remarkable expansion of CDMA M/S : Number 1 in both North American and Indian markets
Continue penetration of GSM market through major carriers: Vodafone, T-Mobile, Cingular, etc.
2003 Results
The handset market expected to outgrow the general expectation
- 510 to 520 million handsets market expected (7~10% YoY growth)
- Replacement demand in North America and Western Europe and new demand from Asia
and Eastern Europe expected
-
Increased demand for next-generation handsets such as color, multimedia and camera phones
- 2004 target sales growth of 32%, representing 36 million handsets
2004 Outlook
2003
1.6
5.9 7.5
2003 Quick Review & 2004 Outlook
Contribution to
Sales
%
1Q
1.6
2Q
1.6
3Q
2.3
4Q
1.9
Product Composition
Total Sales
Telecommunication Equipment & Handset
*The sales on raw materials(outsourcing related) in 2002 are
excluded for like-for-like comparisons.
Contribution to Sales Contribution to
Operating Profit
*Others are excluded in total
24
37
Business Research, development and production of Mobile Handset, Communication System and PC
Contribution to
Operating Profit
%
3.5 5.4
1.9
Telecommunication Equipment & Handset Company |||||||
56
14
10
21
Product
Compositiion
%
Exports Domestic
CDMA GSM
System PC