LG 2003 Annual Report Download - page 36
Download and view the complete annual report
Please find page 36 of the 2003 LG annual report below. You can navigate through the pages in the report by either clicking on the pages listed below, or by using the keyword search tool below to find specific information within the annual report.-
 1
1 -
2
-
3
-
4
-
5
-
6
-
7
-
8
-
9
-
10
-
11
-
12
-
13
-
14
-
15
-
16
-
17
-
18
-
19
-
20
-
21
-
22
-
23
-
24
-
25
-
 26
26 -
 27
27 -
 28
28 -
 29
29 -
 30
30 -
 31
31 -
 32
32 -
 33
33 -
 34
34 -
 35
35 -
 36
36 -
 37
37 -
 38
38 -
 39
39 -
 40
40 -
 41
41 -
 42
42 -
 43
43 -
 44
44 -
 45
45 -
 46
46 -
47
-
48
-
49
-
50
-
51
-
52
-
53
-
54
-
55
-
56
-
57
-
58
-
59
-
60
-
61
-
62
-
63
-
64
-
65
-
66
-
67
-
68
-
69
-
70
-
71
-
72
-
73
-
74
-
75
-
76
-
77
-
78
-
79
-
80
-
81
-
82
-
83
-
84
-
85
-
86
-
87
-
88
-
89
-
90
-
91
-
92
-
93
-
94
-
95
-
96
-
97
-
98
-
99
-
100
-
101
-
102
-
103
-
104
-
105
-
106
-
107
-
108
-
109
-
110
-
111
-
112
-
113
-
114
 |
 |

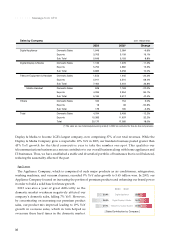
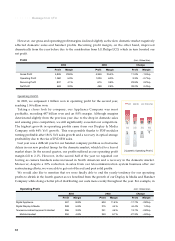
Display & Media to become LGE’s largest company, now comprising 37% of our total revenues. While the
Display & Media Company grew a respectable 10% YoY in 2003, our handsets business posted greater than
45% YoY growth for the third consecutive year to take the number one spot. This qualifies our
telecommunications business as a serious contributor to our overall business along with home appliances and
IT businesses. Thus, we have established a stable and diversified portfolio of businesses that is well balanced,
reducing the seasonality effects of the past.
Appliance
The Appliance Company, which is comprised of such major products as air conditioners, refrigerators,
washing machines, and vacuum cleaners, recorded 9% YoY sales growth to 5.65 trillion won. In 2003, our
Appliance Company focused on increasing the portion of premium products and enhancing our brand power
in order to build a solid base for future growth.
2003 was also a year of great difficultly as the
domestic market weakness negatively affected our
company’s domestic sales, falling 7% YoY. However,
by concentrating on increasing our premium product
sales, our product mix improved leading to 19% YoY
growth in overseas sales, which in turn helped us
overcome these hard times in the domestic market.
36
|||||||Message from CFO
Sales by Company (Unit : Billion Won)
2003 2002* Change
Digital Appliance Domestic Sales 1,946 2,084 -6.6%
Exports 3,703 3,109 19.1%
Sub Total 5,649 5,193 8.8%
Digital Display & Media Domestic Sales 1,133 1,276 -11.2%
Exports 5,752 4,982 15.5%
Sub Total 6,885 6,258 10.0%
Telecom Equipment & Handset Domestic Sales 1,553 1,945 -20.2%
Exports 5,911 3,510 68.4%
Sub Total 7,464 5,454 36.8%
Mobile Handset Domestic Sales 849 1,163 -27.0%
Exports 4,335 2,354 84.1%
Sub Total 5,184 3,517 47.4%
Others Domestic Sales 162 154 5.0%
Exports 18 36 -50.8%
Sub Total 179 190 -5.5%
Total Domestic Sales 4,794 5,458 -12.2%
Exports 15,383 11,637 32.2%
Total 20,177 17,095 18.0%
(*) The sales on raw materials(outsourcing related) in 2002 are excluded for like-for-like comparisons.
[ Sales Contribution by Company ]
2003
2002
30.4% 28.0%
Digital Appliance
36.6% 34.1%
Digital Display & Media
31.9% 37.0%
Telecommunication System