LG 2003 Annual Report Download - page 41
Download and view the complete annual report
Please find page 41 of the 2003 LG annual report below. You can navigate through the pages in the report by either clicking on the pages listed below, or by using the keyword search tool below to find specific information within the annual report.-
 1
1 -
2
-
3
-
4
-
5
-
6
-
7
-
8
-
9
-
10
-
11
-
12
-
13
-
14
-
15
-
16
-
17
-
18
-
19
-
20
-
21
-
22
-
23
-
24
-
25
-
26
-
27
-
28
-
29
-
30
-
 31
31 -
 32
32 -
 33
33 -
 34
34 -
 35
35 -
 36
36 -
 37
37 -
 38
38 -
 39
39 -
 40
40 -
 41
41 -
 42
42 -
 43
43 -
 44
44 -
 45
45 -
 46
46 -
 47
47 -
 48
48 -
 49
49 -
 50
50 -
 51
51 -
52
-
53
-
54
-
55
-
56
-
57
-
58
-
59
-
60
-
61
-
62
-
63
-
64
-
65
-
66
-
67
-
68
-
69
-
70
-
71
-
72
-
73
-
74
-
75
-
76
-
77
-
78
-
79
-
80
-
81
-
82
-
83
-
84
-
85
-
86
-
87
-
88
-
89
-
90
-
91
-
92
-
93
-
94
-
95
-
96
-
97
-
98
-
99
-
100
-
101
-
102
-
103
-
104
-
105
-
106
-
107
-
108
-
109
-
110
-
111
-
112
-
113
-
114
 |
 |

LG Electronics Inc._Annual Report 2003 41
Message from CFO |||||||
and 3G handsets. Our aggressive export drive to overseas markets with these products should allow us to
achieve our growth targets. Moreover, over the mid-term we will continue to promote products with high
growth potential like DMB (digital multimedia broadcasting) handsets, home network, post PC, and
telematics.
Looking at each of our companies and starting with our Appliances, we expect the domestic appliance
market to be similar to 2003, but we will focus on the high-end market in North America and Europe with
premium products like our drum-type washing machine and side-by-side door refrigerator to maintain high
levels of profitability. In Display & Media, we will strive to become the number one player in the PDP market
as our 3rd PDP line will ramp up production in 2004. Moreover, we will take advantage of the growth in the
digital TV market, starting in the US market where a digital broadcasting system is being rapidly adopted.
Against this background, we expect sales of our premium products like LCD monitors and optical storage
products like DVD-RW to be strong this year.
We believe 2004 will be a watershed year for our handset business. We need to expand our global market
share while improving profitability of the business in order to strengthen our position as a major handset
maker. We believe the market will expand rather than shrink and the growth will be led by color handsets
particularly with a camera function. We believe we can take advantage of this opportunity and are targeting
at least 32% growth to more than 36 million units in 2004 to cement our status as a top player in the handset
market. To this end, we plan on strengthening our position in the North American market while expanding
further in the European GSM market. In the domestic market where we did poorly last year, we believe
product leadership and aggressive marketing will help us gain back our market position.
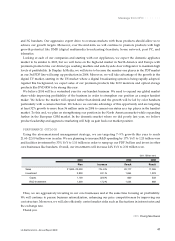
PERFORMANCE OUTLOOK
Using the aforementioned management strategy, we are targeting 7~9% growth this year to reach
21.60~22.00 trillion won in sales. We are planning to increase R&D spending by 17% YoY to 1.20 trillion won
and facilities investment by 33% YoY to 1.10 trillion in order to ramp up our PDP 3rd line and invest in other
core businesses like handsets. Overall, our investments will increase 24% YoY to 2.30 trillion won.
Thus, we are aggressively investing in our core businesses and at the same time focusing on profitability.
We will continue to pursue business rationalization, enhancing our price competitiveness by improving our
cost structure. Moreover, we will also efficiently control market risks such as fluctuations in interest rates and
the exchange rate.
Thank you.
CFO, Young Soo Kwon
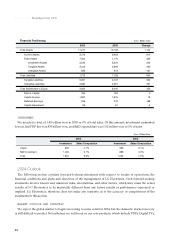
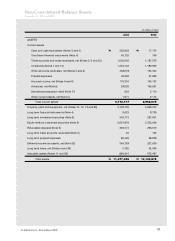
(Unit : Billion won)
2004 2003 2002
Plan Increase Result Result
Sales 21,600~22,000 7%~9% 20,177 17,095
Investment 2,300 24.1% 1,854 1,223
Capex 1,100 32.6% 830 533
R&D Investment 1,200 17.2% 1,024 689