LG 2003 Annual Report Download - page 32
Download and view the complete annual report
Please find page 32 of the 2003 LG annual report below. You can navigate through the pages in the report by either clicking on the pages listed below, or by using the keyword search tool below to find specific information within the annual report.-
 1
1 -
2
-
3
-
4
-
5
-
6
-
7
-
8
-
9
-
10
-
11
-
12
-
13
-
14
-
15
-
16
-
17
-
18
-
19
-
20
-
21
-
 22
22 -
 23
23 -
 24
24 -
 25
25 -
 26
26 -
 27
27 -
 28
28 -
 29
29 -
 30
30 -
 31
31 -
 32
32 -
 33
33 -
 34
34 -
 35
35 -
 36
36 -
 37
37 -
 38
38 -
 39
39 -
 40
40 -
 41
41 -
 42
42 -
43
-
44
-
45
-
46
-
47
-
48
-
49
-
50
-
51
-
52
-
53
-
54
-
55
-
56
-
57
-
58
-
59
-
60
-
61
-
62
-
63
-
64
-
65
-
66
-
67
-
68
-
69
-
70
-
71
-
72
-
73
-
74
-
75
-
76
-
77
-
78
-
79
-
80
-
81
-
82
-
83
-
84
-
85
-
86
-
87
-
88
-
89
-
90
-
91
-
92
-
93
-
94
-
95
-
96
-
97
-
98
-
99
-
100
-
101
-
102
-
103
-
104
-
105
-
106
-
107
-
108
-
109
-
110
-
111
-
112
-
113
-
114
 |
 |

32
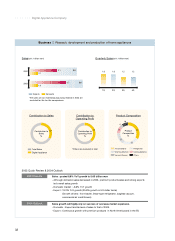
|||||||Digital Appliance Company
제품구성
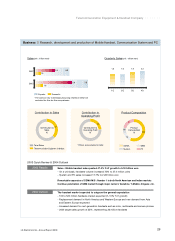
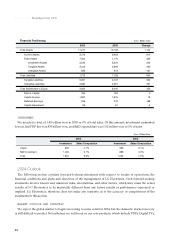
Sales(unit : trillion won) Quarterly Sales(unit : trillion won)
2002*
Sales : posted 8.8% YoY growth to 5.65 trillion won
- Although domestic sales decreased in 2003, premium products sales and strong exports
led overall sales growth
- Domestic market : -6.6% YoY growth
- Export : 19.2% YoY growth (25.8% growth in US dollar terms)
(Growth drivers : front loader, linear-type refrigerator, bagless vacuum,
commercial air conditioners)
2003 Results
Sales growth will highly rely on success of overseas market expansion.
- Domestic : Expect similar level of sales to that of 2003.
- Export : Continuous growth with premium products in North America and in the EU
2004 Outlook
2003
1.9
3.7 5.6
2003 Quick Review & 2004 Outlook
Contribution to
Sales
%
1Q
1.6
2Q
1.6
3Q
1.2
4Q
1.2
Product Composition
33
25
17
11
4
10
Total Sales
Digital Appliance
*The sales on raw materials(outsourcing related) in 2002 are
excluded for like-for-like comparisons.
DomesticExports
Contribution to Sales Contribution to
Operating Profit
*Others are excluded in total
42
28
Business Reseach, development and production of home appliances
Product
Composition
%
Contribution to
Operating Profit
%
3.1 5.2
2.1
Air Conditioner
Washing Machine
Vacuum Cleaner
Refrigerator
Cooking Appliance
Others