LG 2003 Annual Report Download - page 5
Download and view the complete annual report
Please find page 5 of the 2003 LG annual report below. You can navigate through the pages in the report by either clicking on the pages listed below, or by using the keyword search tool below to find specific information within the annual report.-
 1
1 -
 2
2 -
 3
3 -
 4
4 -
 5
5 -
 6
6 -
 7
7 -
 8
8 -
 9
9 -
 10
10 -
 11
11 -
 12
12 -
 13
13 -
 14
14 -
 15
15 -
 16
16 -
17
-
18
-
19
-
20
-
21
-
22
-
23
-
24
-
25
-
26
-
27
-
28
-
29
-
30
-
31
-
32
-
33
-
34
-
35
-
36
-
37
-
38
-
39
-
40
-
41
-
42
-
43
-
44
-
45
-
46
-
47
-
48
-
49
-
50
-
51
-
52
-
53
-
54
-
55
-
56
-
57
-
58
-
59
-
60
-
61
-
62
-
63
-
64
-
65
-
66
-
67
-
68
-
69
-
70
-
71
-
72
-
73
-
74
-
75
-
76
-
77
-
78
-
79
-
80
-
81
-
82
-
83
-
84
-
85
-
86
-
87
-
88
-
89
-
90
-
91
-
92
-
93
-
94
-
95
-
96
-
97
-
98
-
99
-
100
-
101
-
102
-
103
-
104
-
105
-
106
-
107
-
108
-
109
-
110
-
111
-
112
-
113
-
114
 |
 |

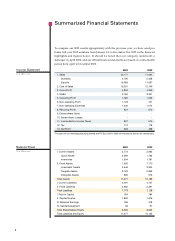
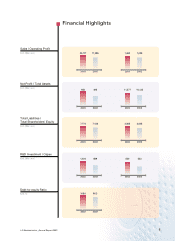
2003 2002
17,09520,177
Sales | Operating Profit
(Unit, Billion won)
Financial Highlights
Net Profit | Total Assets
(Unit, Billion won)
Total Liabilities |
Total Shareholders’ Equity
(Unit, Billion won)
R&D Investment | Capex
(Unit, Billion won)
Debt-to-equity Ratio
(Unit, %)
LG Electronics Inc._Annual Report 2003 5
2003 2002
1,0291,062
2003 2002
7,1287,773
2003 2002
96.3108.0
2003 2002
3,0053,505
2003 2002
498663
2003 2002
10,13311,277
2003 2002
6891,024
2003 2002
533830