Konica Minolta 2013 Annual Report Download - page 50
Download and view the complete annual report
Please find page 50 of the 2013 Konica Minolta annual report below. You can navigate through the pages in the report by either clicking on the pages listed below, or by using the keyword search tool below to find specific information within the annual report.-
 1
1 -
2
-
3
-
4
-
5
-
6
-
7
-
8
-
9
-
10
-
11
-
12
-
13
-
14
-
15
-
16
-
17
-
18
-
19
-
20
-
21
-
22
-
23
-
24
-
25
-
26
-
27
-
28
-
29
-
30
-
31
-
32
-
33
-
34
-
35
-
36
-
37
-
38
-
39
-
 40
40 -
 41
41 -
 42
42 -
 43
43 -
 44
44 -
 45
45 -
 46
46 -
 47
47 -
 48
48 -
 49
49 -
 50
50 -
 51
51 -
 52
52 -
 53
53 -
 54
54 -
 55
55
 |
 |
49
Related Information
(1) Information by product and service
Since the segments of products and services are the same as the reportable segments, information by product and service is omitted.
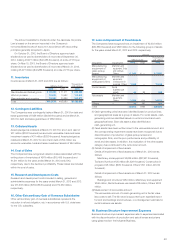
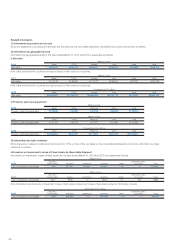
(2) Information by geographical area
Information by geographical area for the year ended March 31, 2013 and 2012 is presented as follows:
i) Net sales
Millions of yen
2013 Japan U.S.A. Europe Asia Other Total
Net sales ............................. ¥226,227 ¥165,755 ¥224,817 ¥132,678 ¥63,596 ¥813,073
Note: Sales are divided into countries and regions based on the locations of customers.
Millions of yen
2012 Japan U.S.A. Europe Asia Other Total
Net sales ............................. ¥214,776 ¥149,540 ¥211,272 ¥129,531 ¥62,757 ¥767,879
Note: Sales are divided into countries and regions based on the locations of customers.
Thousands of U.S. dollars
2013 Japan U.S.A. Europe Asia Other Total
Net sales ............................. $2,405,391 $1,762,414 $2,390,399 $1,410,718 $676,194 $8,645,114
ii) Property, plant and equipment
Millions of yen
2013 Japan China Malaysia Other Total
Property, plant and equipment
... ¥115,569 ¥19,286 ¥16,708 ¥28,340 ¥179,903
Millions of yen
2012 Japan China Malaysia Other Total
Property, plant and equipment
... ¥121,757 ¥18,013 ¥17,767 ¥21,460 ¥178,999
Thousands of U.S. dollars
2013 Japan China Malaysia Other Total
Property, plant and equipment
... $1,228,804 $205,061 $177,650 $301,329 $1,912,844
(3) Information by major customer
Since there are no sales to customers that account for 10% or more of the net sales on the consolidated statements of income, information by major
customer is omitted.
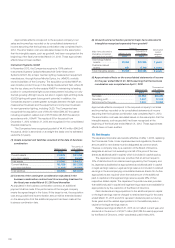
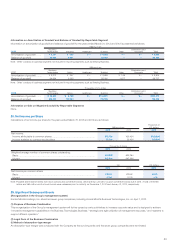
Information on Impairment Losses of Fixed Assets by Reportable Segment
Information on impairment losses of fi xed assets for the year ended March 31, 2013 and 2012 is presented as follows:
Millions of yen
2013
Business
Technologies Industrial Healthcare Subtotal Other
Eliminations and
Corporate Total
Loss on impairment of fi xed assets
....
¥90 ¥1,752 ¥1,058 ¥2,902 ¥— — ¥2,902
Millions of yen
2012
Business
Technologies Optics Healthcare Subtotal Other
Eliminations and
Corporate Total
Loss on impairment of fi xed assets
....
¥227 ¥603 ¥— ¥830 ¥— ¥62
¥893
Note: Eliminations and Corporate of impairment losses of fi xed assets is impairment losses of fi xed assets owned by the holding company.
Thousands of U.S. dollars
2013
Business
Technologies Industrial Healthcare Subtotal Other
Eliminations and
Corporate Total
Loss on impairment of fi xed assets
....
$957 $18,628 $— $30,856 $— — $30,856