Konica Minolta 2013 Annual Report Download - page 41
Download and view the complete annual report
Please find page 41 of the 2013 Konica Minolta annual report below. You can navigate through the pages in the report by either clicking on the pages listed below, or by using the keyword search tool below to find specific information within the annual report.-
 1
1 -
2
-
3
-
4
-
5
-
6
-
7
-
8
-
9
-
10
-
11
-
12
-
13
-
14
-
15
-
16
-
17
-
18
-
19
-
20
-
21
-
22
-
23
-
24
-
25
-
26
-
27
-
28
-
29
-
30
-
 31
31 -
 32
32 -
 33
33 -
 34
34 -
 35
35 -
 36
36 -
 37
37 -
 38
38 -
 39
39 -
 40
40 -
 41
41 -
 42
42 -
 43
43 -
 44
44 -
 45
45 -
 46
46 -
 47
47 -
 48
48 -
 49
49 -
 50
50 -
 51
51 -
52
-
53
-
54
-
55
 |
 |

40
The amount available for dividends under the Japanese Corporate
Law is based on the amount recorded in the Company’s
nonconsolidated books of account in accordance with accounting
principles generally accepted in Japan.
On October 31, 2012, the Board of Directors approved cash
dividends to be paid to shareholders of record as of September 30,
2012, totaling ¥3,977 million ($42,286 thousand), at a rate of ¥7.5 per
share. On May 10, 2013, the Board of Directors approved cash
dividends to be paid to shareholders of record as of March 31, 2013,
totaling ¥3,977 million ($42,286 thousand), at a rate of ¥7.5 per share.
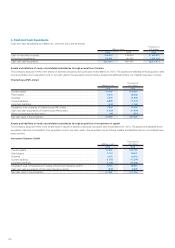
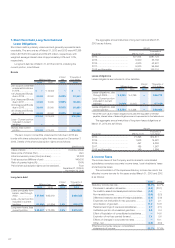
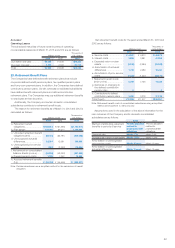
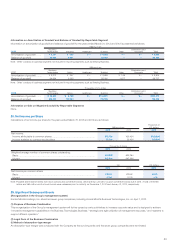
11. Inventories
Inventories as of March 31, 2013 and 2012 are as follows:
Millions of yen
Thousands of
U.S. dollars
2013 2012 2013
Merchandise and fi nished goods
... ¥ 82,788 ¥ 71,211 $ 880,255
Work in process ...................... 10,610 13,482 112,812
Raw materials and supplies ...... 19,080 20,386 202,871
Total ...................................... ¥112,479 ¥105,080 $1,195,949
12. Contingent Liabilities
The Companies were contingently liable at March 31, 2013 for debt and
lease guarantees of ¥456 million ($4,848 thousand) and at March 31,
2012 for debt and lease guarantees of ¥652 million.
13. Collateral Assets
Assets pledged as collateral at March 31, 2013 for short-term debt of
¥31 million ($330 thousand) are accounts receivable–trade and lease
investment assets of ¥31 million ($330 thousand). Assets pledged as
collateral at March 31, 2012 for short-term debt of ¥54 million are
accounts receivable–trade and lease investment assets of ¥54 million.
14. Cost of Sales
The Companies have recognized valuation losses associated with the
writing down of inventories of ¥979 million ($10,409 thousand) and
¥1,511 million for the years ended March 31, 2013 and 2012,
respectively, due to the decline in profi tability. These losses are included
within the cost of sales.
15. Research and Development Costs
Research and development costs included in selling, general and
administrative expenses for the years ended March 31, 2013 and 2012
are ¥71,533 million ($760,585 thousand) and ¥72,530 million,
respectively.
16. Other Extraordinary Gain of Overseas Subsidiaries
Other extraordinary gain of overseas subsidiaries represents the
reduction in refund obligation, etc. in accordance with U.S. state laws
for the U.S. subsidiary.
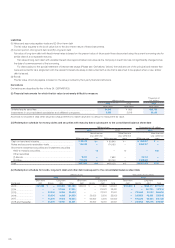
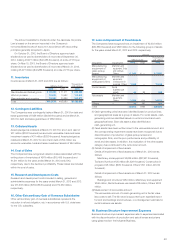
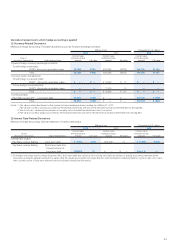
17. Loss on Impairment of Fixed Assets
The Companies have recognized loss on impairment of ¥2,902 million
($30,856 thousand) and ¥893 million for the following groups of assets
for the years ended March 31, 2013 and 2012, respectively:
Amount
Millions of yen
Thousands of
U.S. dollars
Description Classifi cation 2013 2012 2013
Manufacturing
equipment of
glass pickup
lenses
Machinery and
equipment, Tools
and furniture,
Others
¥ 365 ¥ — $ 3,881
Manufacturing
equipment of
radiographic fi lms
Machinery and
equipment,
Construction in
progress, Others
1,058 —11,249
Rental assets
Rental
business-use
assets
44 88 468
Idle assets
Machinery and
equipment,
Others
1,399 614 14,875
Others — 34 190 362
Total ¥2,902 ¥893 $30,856
(1) Cash-generating units have been identifi ed based on product lines
and geographical areas as a group of assets. For rental assets, cash-
generating units are identifi ed based on rental contracts and each
geographical area. Each idle asset is also identifi ed as a
cash-generating unit.
(2) Fixed assets have been written down to the recoverable amount and
the corresponding impairment losses have been recognized due to
discontinuation of production of glass pickup lenses and
radiographic fi lms, and the poor performance and profi tability of
rental and idle assets. In addition, the revaluation of the other assets
category has contributed to the write down amount.
(3) Details of impairment of fi xed assets
Details of impairment of fi xed assets as of March 31, 2013 are as
follows:
Machinery and equipment ¥2,626 million ($27,921 thousand),
Tools and furniture ¥125 million ($1,329 thousand), Construction in
progress ¥48 million ($510 thousand), Others ¥101 million ($1,074
thousand).
Details of impairment of fi xed assets as of March 31, 2012 are as
follows:
Buildings and structures ¥254 million, Machinery and equipment
¥346 million, Rental business-use assets ¥88 million, Others ¥203
million.
(4) Measurement of recoverable amount
The recoverable amount of a cash-generating unit is the fair value
less costs to sell. The fair value is supported by an appraisal report
for land and buildings and structures, or a management estimate for
rental business-use assets.
18. Business Structure Improvement Expenses
Business structure improvement expenses refer to expenses associated
with the discontinuation of production and sale of lenses and prisms
using glass molds in the Industrial Business.