Konica Minolta 2013 Annual Report Download - page 28
Download and view the complete annual report
Please find page 28 of the 2013 Konica Minolta annual report below. You can navigate through the pages in the report by either clicking on the pages listed below, or by using the keyword search tool below to find specific information within the annual report.-
 1
1 -
2
-
3
-
4
-
5
-
6
-
7
-
8
-
9
-
10
-
11
-
12
-
13
-
14
-
15
-
16
-
17
-
 18
18 -
 19
19 -
 20
20 -
 21
21 -
 22
22 -
 23
23 -
 24
24 -
 25
25 -
 26
26 -
 27
27 -
 28
28 -
 29
29 -
 30
30 -
 31
31 -
 32
32 -
 33
33 -
 34
34 -
 35
35 -
 36
36 -
 37
37 -
 38
38 -
39
-
40
-
41
-
42
-
43
-
44
-
45
-
46
-
47
-
48
-
49
-
50
-
51
-
52
-
53
-
54
-
55
 |
 |
27
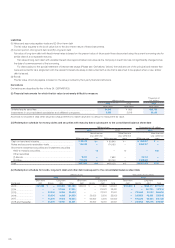
CONSOLIDATED STATEMENTS OF INCOME AND
CONSOLIDATED STATEMENTS OF COMPREHENSIVE INCOME
Konica Minolta, Inc. and Consolidated Subsidiaries
For the scal years ended March 31, 2013 and 2012
Consolidated Statements of Income
Millions of yen
Thousands of
U.S. dollars
(Note 3)
2013 2012 2013
Net Sales .................................................................................................................. ¥813,073 ¥767,879 $8,645,114
Cost of Sales (Note 14) ............................................................................................. 437,487 412,562 4,651,643
Gross profi t ............................................................................................................. 375,585 355,317 3,993,461
Selling, General and Administrative Expenses (Note 15) ..................................... 334,926 314,971 3,561,148
Operating income ................................................................................................... 40,659 40,346 432,313
Other Income (Expenses):
Interest and dividend income ................................................................................. 1,476 1,563 15,694
Interest expenses ................................................................................................... (2,499) (2,519) (26,571)
Foreign exchange gain (loss), net ........................................................................... 1,508 (2,567) 16,034
Loss on sales and disposals of property, plant and equipment, net ...................... (1,661) (1,693) (17,661)
Write-down of investment securities ....................................................................... (2) (2,700) (21)
Gain on sales of investment securities, net ............................................................ 55 2585
Gain on sales of investments in capital ................................................................... —604 —
Loss on impairment of fi xed assets (Note 17) ......................................................... (2,902) (893) (30,856)
Gain on discontinued operations ............................................................................ —19 —
Equity in income of unconsolidated subsidiaries and affi liates, net ........................ 61 67 649
Gain on reversal of foreign currency translation adjustment ................................... —3,730 —
Other extraordinary gain of overseas subsidiaries (Note 16) .................................. 95 241 1,010
Business structure improvement expenses (Note 18) ............................................ (379) (1,198) (4,030)
Group restructuring expenses ................................................................................ (296) —(3,147)
Loss on disaster ..................................................................................................... —(57) —
Other, net ................................................................................................................ (2,278) (2,132) (24,221)
Total ..................................................................................................................... (6,823) (7,531) (72,547)
Income before income taxes and minority interests ............................................... 33,836 32,815 359,766
Income Taxes (Note 8):
Current.................................................................................................................... 11,745 9,553 124,880
Deferred .................................................................................................................. 6,934 2,776 73,727
Total ..................................................................................................................... 18,680 12,330 198,618
Income before minority interests ............................................................................ 15,155 20,484 161,138
Minority Interests in Net Income of Consolidated Subsidiaries ......................... 30 60 319
Net Income ............................................................................................................... ¥ 15,124 ¥ 20,424 $ 160,808
Yen
U.S. dollars
(Note 3)
2013 2012 2013
Per Share Data (Notes 10 and 28):
Net income —Basic ................................................................................................ ¥28.52 ¥38.52 $0.30
—Diluted .............................................................................................. 27.86 37.28 0.30
Cash dividends ....................................................................................................... 15 15 0.16
The accompanying Notes to the Consolidated Financial Statements are an integral part of these fi nancial statements.