Konica Minolta 2013 Annual Report Download - page 20
Download and view the complete annual report
Please find page 20 of the 2013 Konica Minolta annual report below. You can navigate through the pages in the report by either clicking on the pages listed below, or by using the keyword search tool below to find specific information within the annual report.-
 1
1 -
2
-
3
-
4
-
5
-
6
-
7
-
8
-
9
-
 10
10 -
 11
11 -
 12
12 -
 13
13 -
 14
14 -
 15
15 -
 16
16 -
 17
17 -
 18
18 -
 19
19 -
 20
20 -
 21
21 -
 22
22 -
 23
23 -
 24
24 -
 25
25 -
 26
26 -
 27
27 -
 28
28 -
 29
29 -
 30
30 -
31
-
32
-
33
-
34
-
35
-
36
-
37
-
38
-
39
-
40
-
41
-
42
-
43
-
44
-
45
-
46
-
47
-
48
-
49
-
50
-
51
-
52
-
53
-
54
-
55
 |
 |
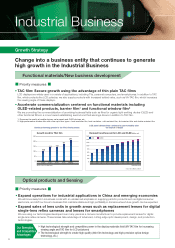
As a result, Industrial Business segment sales amounted to ¥146.7 billion, and
segment profi t stood at ¥23.6 billion. Sales volume increased for the segment’s main
products overall, with the exception of some products in fi elds such as the optical
products fi eld. Both segment sales and profi t increased.
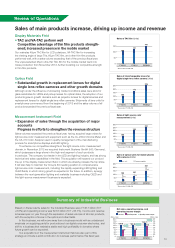
Healthcare Business
In the Healthcare Business, the Company worked to expand sales of digital X-ray
diagnostic systems to medical facilities in Japan and overseas. The AeroDR, a
cassette-style digital X-ray system featuring a proprietary high-image quality scintillator
developed and manufactured by the Company is compact and the world’s lightest
system while delivering lower exposure and high image quality. Sales for applications
such as regular X-ray equipment and hospital rounds are expanding further, offsetting
the decline in sales of fi lm products chiefl y in developed countries.
As a result, Healthcare Business segment sales amounted to ¥72.7 billion, down
0.4% year on year, and segment profi t increased substantially from ¥90 million in the
previous fi scal year to ¥3.3 billion as a result of the increase in gross profi t associated
with rising sales of digital X-ray systems and initiatives to improve profi tability.
Cash Flows
Cash Flows from Operating Activities:
Net cash provided by operating activities was ¥66.4 billion, compared with ¥72.3
billion for the previous fi scal year. Income before income taxes and minority interests
provided cash of ¥33.8 billion. Depreciation and amortization totaled ¥45.9 billion, and
amortization of goodwill totaled ¥9.8 billion. Uses of cash included a decrease in
working capital of ¥11.1 billion and income taxes paid of ¥13.5 billion.
Cash Flows from Investing Activities:
Net cash used in investing activities was ¥63.4 billion, compared with ¥42.7 billion for
the previous fi scal year. Payment for acquisition of property, plant and equipment used
cash of ¥31 billion. Principal investments included molds for new products in the
Business Technologies Business and investment in new businesses and enhancing
production effi ciency in the Industrial Business. Other uses of cash included ¥23.1
billion for payment for acquisition of shares in subsidiaries and transfer of business
associated with acquisitions in Japan, Europe, the United States and Asia to
strengthen production print and IT service capabilities in the Business Technologies
Business and acquisition of equity in subsidiaries in the Industrial Business.
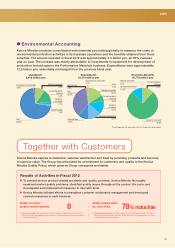
As a result, free cash fl ow, calculated as the sum of cash fl ows from operating
and investing activities, was ¥3.0 billion, compared with free cash fl ow of ¥29.6 billion
for the previous fi scal year.
Cash Flows from Financing Activities
Net cash used in fi nancing activities was ¥24.5 billion, compared with net cash
provided of ¥26.3 billion in the previous fi scal year. Uses of cash included payment of
¥40 billion for the redemption of corporate bonds and cash dividends paid of ¥7.9
billion while a net increase in short-term and long-term loans payable provided cash of
¥24.9 billion.
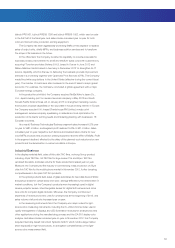
Capital Expenditure and Depreciation
Total capital expenditure for the year ended March 31, 2013 increased ¥4.4 billion, or
13.0%, year on year to ¥38.4 billion. By business segment, capital expenditure totaled
¥22.0 in the Business Technologies Business, ¥9.4 billion in the Industrial Business
and ¥1.5 billion in the Healthcare Business. Principal capital expenditure for the fi scal
year ended March 31, 2013 included investment in molds for new products in the
23.2
29.6
10
20
30
40
0
26.2
37.4
3.0
27.4
Free cash flow
CF from operating activities -
CF from investing activities
FY2011FY2010 FY2012
(Billions
of yen)
R&D expenses for common technology
platforms and leading-edge technologies
12.4 13.1
5
10
15
20
0
14.6
FY2011FY2010 FY2012
(Billions of yen)
42.9
34.0
0
55.1 49.2
38.4
45.9
CAPEX Depreciation
FY2011FY2010 FY2012
(Billions of yen)
15
30
45
60
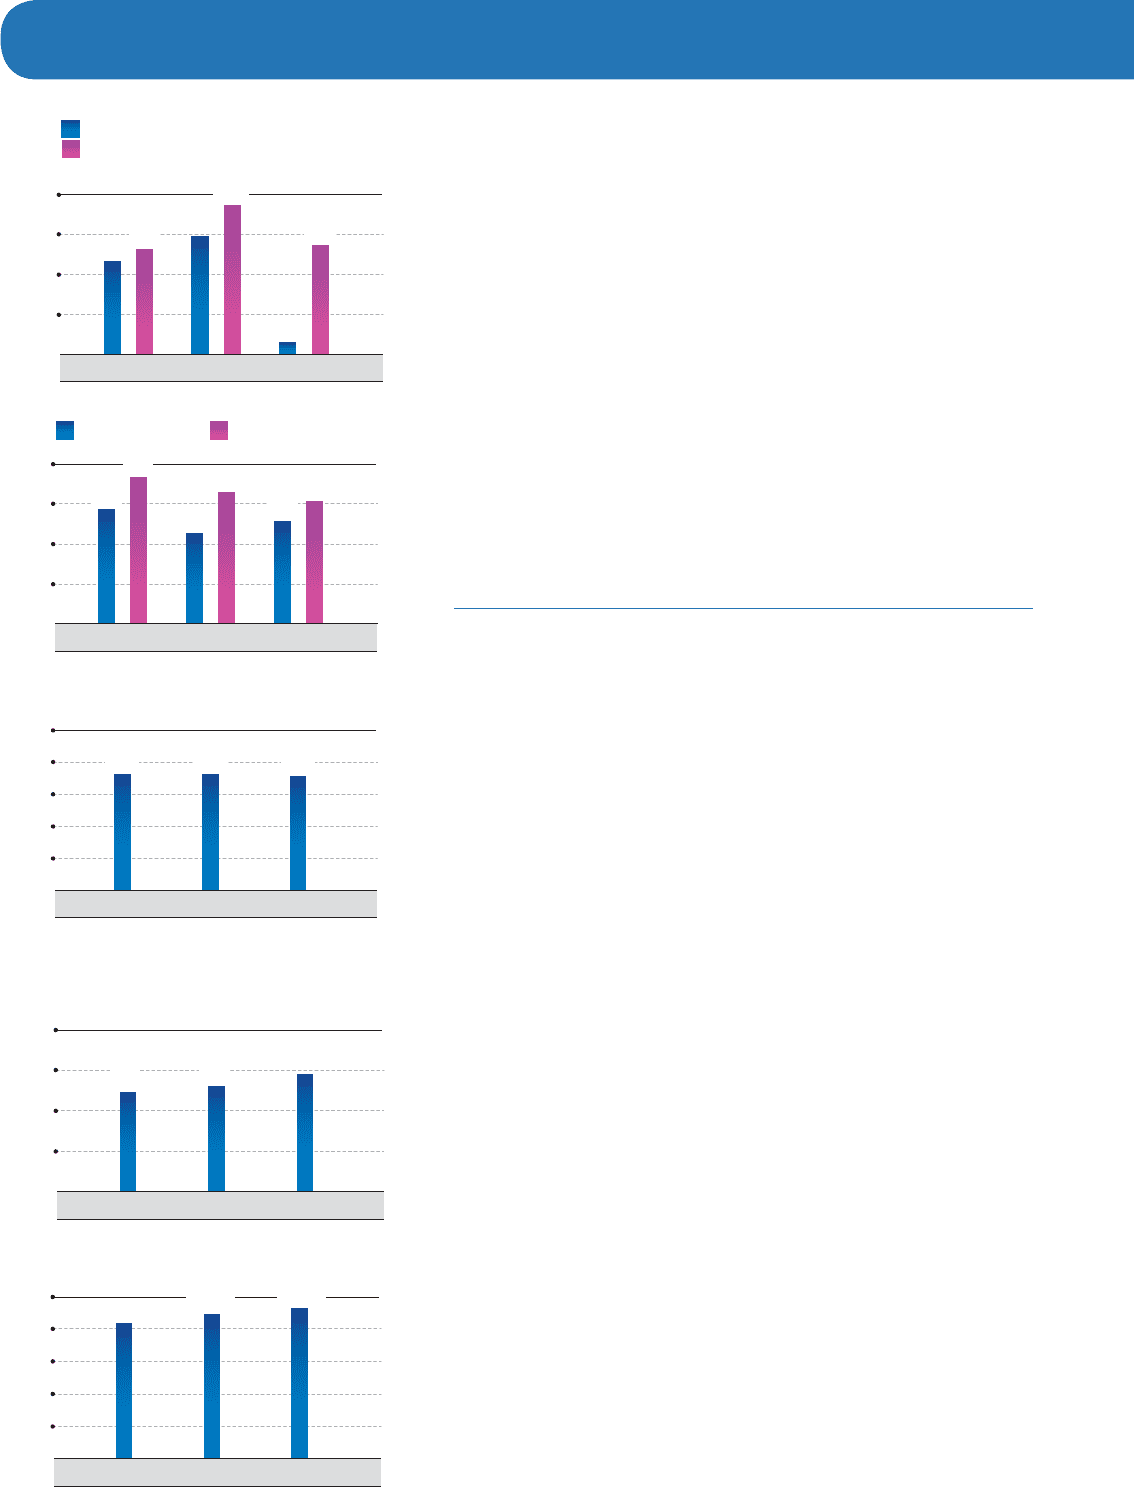
Total assets
845.4 902.0
0
940.5
FY2011FY2010 FY2012
(Billions of yen)
1,000
200
400
600
800
R&D expenses
72.6 72.5
20
40
60
80
0
71.5
FY2011FY2010 FY2012
(Billions of yen)
100
19