Konica Minolta 2013 Annual Report Download - page 47
Download and view the complete annual report
Please find page 47 of the 2013 Konica Minolta annual report below. You can navigate through the pages in the report by either clicking on the pages listed below, or by using the keyword search tool below to find specific information within the annual report.-
 1
1 -
2
-
3
-
4
-
5
-
6
-
7
-
8
-
9
-
10
-
11
-
12
-
13
-
14
-
15
-
16
-
17
-
18
-
19
-
20
-
21
-
22
-
23
-
24
-
25
-
26
-
27
-
28
-
29
-
30
-
31
-
32
-
33
-
34
-
35
-
36
-
 37
37 -
 38
38 -
 39
39 -
 40
40 -
 41
41 -
 42
42 -
 43
43 -
 44
44 -
 45
45 -
 46
46 -
 47
47 -
 48
48 -
 49
49 -
 50
50 -
 51
51 -
 52
52 -
 53
53 -
 54
54 -
 55
55
 |
 |

46
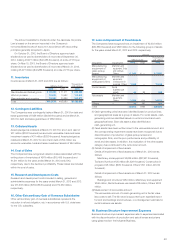
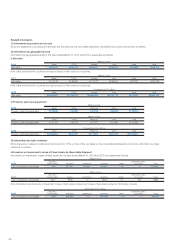
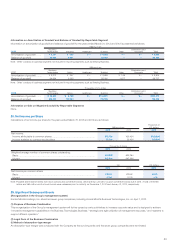
The following table summarizes the movement of outstanding stock
options for the years ended March 31, 2013 and 2012.
Number of Shares
Stock options outstanding at March 31, 2011 .... 746,500
Granted ....................................................... 239,500
Exercised ..................................................... 68,000
Forfeited ...................................................... 2,000
Stock options outstanding at March 31, 2012 .... 916,000
Granted ....................................................... 285,500
Exercised ..................................................... 47,500
Forfeited ...................................................... 6,000
Stock options outstanding at March 31, 2013 .... 1,148,000
The following table summarizes price information of stock options
exercised during the period and outstanding stock options as of March
31, 2013.
Per unit information Exercised
Outstanding at
March 31, 2013
Exercise price of stock options ............. ¥ 1 ¥ 1
Average market price of the stock at the
time of exercise ................................ 651 —
Fair value per unit (as of grant date) ....... 1,242 750
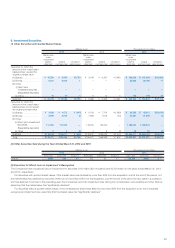
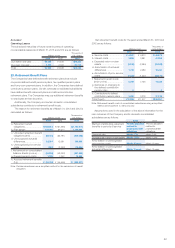
26. Investment and Rental Property
(1) Conditions and Fair Values of Investment and Rental Property
The Companies have offi ce buildings for rent and idle assets, etc., in
Japan and overseas.
The book value on the consolidated balance sheet, the changes
and the fair value as of March 31, 2013 and 2012 are as follows:
Millions of yen
Thousands of
U.S. dollars
2013 2012 2013
Book value
Balance at the beginning
..... ¥4,486 ¥3,560 $47,698
Increase (Decrease)–net .... (558) 926 (5,933)
Balance at the end ............ ¥3,928 ¥4,486 $41,765
Fair value at the end............. ¥4,457 ¥5,042 $47,390
Notes: 1. Book value is calculated by subtracting accumulated depreciation
and accumulated impairment losses from acquisition cost.
2. Fair value is recorded as follows:
(1) Fair value of major domestic properties has been calculated by
the Companies based on a method similar to the Real-estate
Appraisal Standards.
Latest appraisal reports are utilized, or in the case where there
are no signifi cant changes in the index refl ected fair value, prior
period reports may be used.
Fair value of other domestic properties has been calculated
based on certain appraisal or criteria, which appears to best
refl ect the fair value of the property.
(2) Fair value of overseas properties has been primarily calculated by
local real-estate appraisers.
(2) Income and Expenses on Investment and Rental Property
Millions of yen
Thousands of
U.S. dollars
2013 2012 2013
Income .............................. ¥161 ¥184 $1,712
Expenses ........................... 89 92 946
Difference .......................... 72 92 766
Other losses on sales, etc. .... (94) (164) (999)
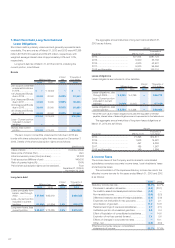
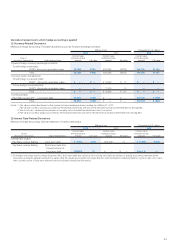
27. Segment Information
Information and Measurement of Segments
(1) Overview of reportable segments
The Company’s reportable segments are components of the Company
for which separate fi nancial information is available and evaluated
regularly by management in deciding how to allocate resources and
assess performance.
The Company has business companies for different products and
services within Japan. Each business company creates a
comprehensive domestic and overseas strategy for their products and
services, and conducts its business activities accordingly.
As such, the Company is comprised of three segments for different
products and services with a business company at the center of each.
The three reportable segments are: Business Technologies, Industrial
and Healthcare.
Business Technologies manufactures and sells MFPs, printers, and
equipment for production printing systems and graphic arts, and
provides related solution services. The Industrial Business
manufactures and sells electronic materials (TAC fi lms, etc.),
performance materials, optical products (pickup lenses, etc.), and
measuring instruments for industrial and healthcare applications. The
Healthcare Business manufactures and sells consumables and
equipment for healthcare systems.
Upon reorganization of the Group during the fi scal year ended
March 31, 2013, the reportable segments were changed from the
Business Technologies Business, Optics Business, and Healthcare
Business to the Business Technologies Business, Industrial Business
and Healthcare Business beginning from the fi rst quarter of the fi scal
year ended March 31, 2013. The Optics business included the
manufacturing and sale of optical products (pickup lenses, etc.) and
electronic materials (TAC fi lms, etc.) while the Industrial Business
includes the manufacturing and sale of electronic materials (TAC fi lms,
etc.), performance materials, optical products (pickup lenses, etc.) and
measuring instruments for industrial and healthcare applications.
Meanwhile the main products and types of services both in Business
Technologies Business and Healthcare Business were not changed.
Segment information for the previous fi scal year in accordance with the
revised reportable segments is not disclosed except for external sales,
amortization of goodwill and investments in equity method affi liates
because it is not practicable to accurately calculate cost of sales,
selling, general and administrative expenses, assets and liabilities
retroactively. Also, segment information for the fi scal year ended March
31, 2013 in accordance with the reportable segments used for the
previous fi scal year is not disclosed because it is not practicable to
obtain the necessary information and it is not reported to management
in consideration of the usefulness of the information. If we prepared
segment information for the previous year in accordance with the
revised reportable segments, external sales are ¥135,117 million in the
Industrial Business and ¥12,139 million in Other. Also, amortization of
goodwill is ¥492 million in the Industrial Business and ¥0 in Other, and
unamortized goodwill is ¥5,032 million in the Industrial Business and ¥0
in Other. In addition, investments in equity method affi liates is ¥0 in the
Industrial Business.