Konica Minolta 2013 Annual Report Download - page 11
Download and view the complete annual report
Please find page 11 of the 2013 Konica Minolta annual report below. You can navigate through the pages in the report by either clicking on the pages listed below, or by using the keyword search tool below to find specific information within the annual report.
Sales of main products increase, driving up income and revenue
•
TAC and VA-TAC perform well
Competitive advantage of thin fi lm products strength-
ened; increased presence in the mobile market
Display Materials Field
Our mainstay 40m TAC fi lm for LCD polarizers, VA-TAC fi lm for increasing
theviewing angle of large TVs, 60m TAC fi lm, and other thin-fi lm products
performed well, with a sales volume exceeding that of the previous fi scal year.
Theunprecedented 25m ultra-thin TAC fi lm for the mobile market went into
massproduction from November 2012, further boosting our competitive strength
inthin-fi lm products.
•
Substantial growth in replacement lenses for digital
single lens refl ex cameras and other growth domains
Optics Field
Although under the infl uence of worsening market conditions sales were slow for
glass substrates for HDDs and pickup lenses for optical disks, the adoption of our
products grew in growth domains such as projector lenses for digital cinemas and
replacement lenses for digital single lens refl ex cameras. Shipments of lens units for
smartphones commenced from the beginning of 2012 and the sales volume of all
products exceeded the previous fi scal year.
•
Expansion of sales through the acquisition of major
accounts
Progress in efforts to strengthen the revenue structure
Measurement Instrument Field
Sales volumes exceeded the previous fi scal year, having acquired large orders for
light-source color measurement equipment such as the CL-200A Chroma Meter and
the CA-310 Color Analyzer used in quality management of the manufacturing
process for smartphone displays and LED lighting.
To enhance our competitive strengths in the light-source color measurement
domain, in November 2012 we acquired Instrument Systems GmbH (HO: Germany),
which possesses a large share in the high-end segment of such products
inparticular. The company is a leader in the LED and lighting industry and has strong
technical and sales capabilities in the fi eld. This acquisition will expand our product
line-up in the display measurement fi eld, in which we already possess the top share.
It will also help to maintain the Group’s fi rm leading position in comprehensive
light-source color measurement, including the rapidly expanding LED lighting and
OLED fi elds, in which strong growth isexpected in the future. In addition, synergy
between the next-generation lighting and materials business including OLED and
this light-source measurement business is expected.
Review of Operations
Summary of Industrial Business
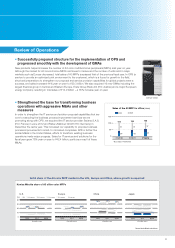
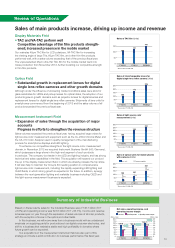
Based on these results, sales for the Industrial Business were ¥146.7 billion (YoY
+8.6%) and operating income was ¥23.6 billion (YoY +55.7%). Income and revenue
increased year on year through the expansion of sales volumes of all main products,
with the exception of some in the optics and other fi elds.
In this business, we will move away from a business model with an unbalanced
emphasis on supplying parts for products such as digital consumer electronics, and
shift to a business that maintains stable and high profi tability in domains where
future growth can be expected.
Our acquisitions in the measurement instrument fi eld are also part of this
strategy and made a solid contribution to business performance this fi scal year.
*Base index: FY2010=100
FY2012FY2011FY2010
0
50
100
150
100
121
149
Sales of TAC film (Units)
*Base index: FY2010=100
FY2012FY2011FY2010
0
50
100
150
200
250
100
173
246
Sales of interchangeable lenses for
digital single-lens reflex camera (Units)
*Base index: FY2010=100
FY2012FY2011FY2010
0
50
100
150
200
250
300
100
195
251
Sales of light source color
measurement (Units)
Lens unit Camera module
*Base index: FY2010=100
FY2012FY2011FY2010
0
50
100
150
200
250
100
32
68 44
63
65
137
107
201
Sales of optical units for mobile phones
with cameras (Units)
Operating income marginNet sales Operating income
FY2012FY2011FY2010
0
50
10
15
20
25
30
35
40
0
25
50
75
100
125
150
175
200
(Billions of yen)(Billions of yen)
9.8% 11. 2%
16.1%
129.8
12.8
124.3
14.0
146.7
23.6
Net sales, operating income, and
operating income margin
10

