Konica Minolta 2013 Annual Report Download - page 49
Download and view the complete annual report
Please find page 49 of the 2013 Konica Minolta annual report below. You can navigate through the pages in the report by either clicking on the pages listed below, or by using the keyword search tool below to find specific information within the annual report.-
 1
1 -
2
-
3
-
4
-
5
-
6
-
7
-
8
-
9
-
10
-
11
-
12
-
13
-
14
-
15
-
16
-
17
-
18
-
19
-
20
-
21
-
22
-
23
-
24
-
25
-
26
-
27
-
28
-
29
-
30
-
31
-
32
-
33
-
34
-
35
-
36
-
37
-
38
-
 39
39 -
 40
40 -
 41
41 -
 42
42 -
 43
43 -
 44
44 -
 45
45 -
 46
46 -
 47
47 -
 48
48 -
 49
49 -
 50
50 -
 51
51 -
 52
52 -
 53
53 -
 54
54 -
 55
55
 |
 |
48
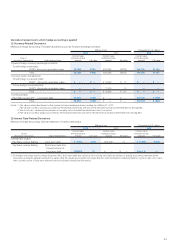
Millions of yen
2012
Business
Technologies Optics
Healthcare
(Note 2) Subtotal
Other
(Note 1) Total Adjustments
Total amounts
in consolidated
fi n a n c i a l
statements
Net sales
External ............................................ ¥547,576 ¥124,313 ¥73,046 ¥744,936 ¥22,943 ¥767,879 ¥ — ¥767,879
Intersegment ..................................... 1,853 755 1,930 4,539 48,206 52,745 (52,745) —
Total ............................................... 549,430 125,068 74,976 749,475 71,149 820,625 (52,745) 767,879
Segment profi t ..................................... 39,479 14,038 91 53,608 5,554 59,163 (18,817) 40,346
Segment assets ................................... 399,754 118,864 65,000 583,620 56,593 640,213 261,839 902,052
Segment liabilities ................................ 195,304 66,401 41,020 302,727 25,728 328,455 138,609 467,064
Other items
Depreciation and amortization .............. ¥ 21,377 ¥ 16,657 ¥ 3,105 ¥ 41,140 ¥ 3,846 ¥ 44,987 ¥ 4,252 ¥ 49,239
Amortization of goodwill ..................... 8,312 347 — 8,659 145 8,804 — 8,804
Investments in affi liated companies ....... 3 — 734 737 — 737 985 1,722
Increases in property, plant and
equipment and intangible fi xed assets
... 17,781 6,606 2,351 26,739 5,946 32,685 1,347 34,033
Notes: 1. ‘Other’ consists of business segments not included in reporting segments such as Sensing Business and Industrial Inkjet Business.
2. Adjustments are as follows:
(1) Adjustments of segment profi t represent the elimination of intersegment transactions and expenses relating to the corporate division of the Company,
which totaled ¥(5,311) million and ¥(13,505) million, respectively. Corporate expenses are primarily general administration expenses and R&D expenses
that can not be allocated to any reportable segment.
(2) Adjustments of segment assets represent the elimination of intersegment assets and assets relating to the corporate division of the Company, which
totaled ¥(48,363) million and ¥310,202 million, respectively. Corporate assets are primarily surplus funds of the holding company (cash on hand and in
banks and short-term investment securities), long-term investment funds (investment securities), and assets owned by the holding company that can not
be allocated to any reportable segment.
(3) Adjustments of segment liabilities represent the elimination of intersegment liabilities and liabilities relating to the corporate division of the Company, which
totaled ¥(27,425) million and ¥166,034 million, respectively. Corporate liabilities are primarily interest-bearing debts (loans payable and bonds payable), and
liabilities owned by the holding company that can not be allocated to any reportable segment.
(4) Adjustments of depreciation and amortization primarily represent depreciation of buildings of the holding company.
(5) Adjustments of investments in affi liated companies primarily represent investments by the holding company in equity method affi liates.
(6) Adjustments of increases in property, plant and equipment and intangible fi xed assets primarily represent capital expenditure on buildings in relation to the
holding company.
Thousands of U.S. dollars
2013
Business
Technologies Industrial Healthcare Subtotal Other Total Adjustment
Total amounts
in consolidated
fi n a n c i a l
statements
Net sales
External .............................................. $6,184,359 $1,560,787 $773,557 $8,518,703 $126,411 $8,645,114 $ — $ 8,645,114
Intersegment ....................................... 20,585 25,901 28,198 74,705 556,119 630,835 (630,835) —
Total ................................................. 6,204,955 1,586,699 801,765 8,593,418 682,531 9,275,960 (630,835) 8,645,114
Segment profi t ....................................... 336,608 251,643 35,598 623,870 47,581 671,462 (239,139) 432,313
Segment assets ..................................... 4,948,315 1,594,971 702,616 7,245,922 548,538 7,794,460 2,206,103 10,000,564
Segment liabilities .................................. 2,541,925 884,338 445,859 3,872,132 236,842 4,108,974 932,355 5,041,318
Other items
Depreciation and amortization ................ $ 251,462 $ 148,145 $ 26,082 $ 425,699 $ 19,915 $ 445,614 $ 43,466 $ 489,091
Amortization of goodwill ....................... 98,682 6,188 — 104,870 — 104,870 — 104,870
Investments in affi liated companies ......... 32 — 5,306 5,348 — 5,348 10,526 15,885
Increases in property, plant and
equipment and intangible fi xed assets ... 234,099 100,638 16,693 351,441 25,529 376,970 31,781 408,761