Konica Minolta 2013 Annual Report Download - page 36
Download and view the complete annual report
Please find page 36 of the 2013 Konica Minolta annual report below. You can navigate through the pages in the report by either clicking on the pages listed below, or by using the keyword search tool below to find specific information within the annual report.-
 1
1 -
2
-
3
-
4
-
5
-
6
-
7
-
8
-
9
-
10
-
11
-
12
-
13
-
14
-
15
-
16
-
17
-
18
-
19
-
20
-
21
-
22
-
23
-
24
-
25
-
 26
26 -
 27
27 -
 28
28 -
 29
29 -
 30
30 -
 31
31 -
 32
32 -
 33
33 -
 34
34 -
 35
35 -
 36
36 -
 37
37 -
 38
38 -
 39
39 -
 40
40 -
 41
41 -
 42
42 -
 43
43 -
 44
44 -
 45
45 -
 46
46 -
47
-
48
-
49
-
50
-
51
-
52
-
53
-
54
-
55
 |
 |
35
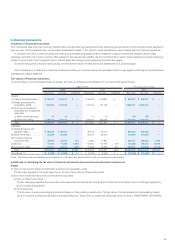
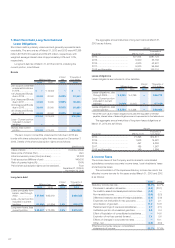
Liabilities
(1) Notes and accounts payable–trade and (2) Short-term debt
The fair value equates to the book value due to the short-term nature of these instruments.
(3) Current portion of long-term debt and (5) Long-term debt
Fair value of long-term debt with fi xed interest rates is based on the present value of future cash fl ows discounted using the current borrowing rate for
similar debt of a comparable maturity.
Fair value of long-term debt with variable interest rates approximates book value as the Company’s credit risk has not signifi cantly changed since
the date of commencement of the borrowing.
For debt subject to the special treatment of interest-rate swaps (Please see ‘Derivatives’ below), the total amount of the principal and interest that
were accounted for as a single item with the relevant interest-rate swap is discounted with a rate that is assumed to be applied when a new, similar
debt is issued.
(4) Bonds
The fair value of bonds payable is based on the value provided by third-party fi nancial institutions.
Derivatives
Derivatives are described further in Note 24. DERIVATIVES.
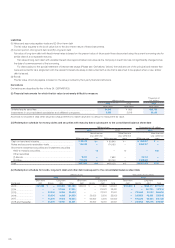
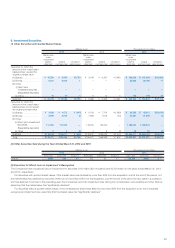
(ii) Financial instruments for which the fair value is extremely diffi cult to measure
Millions of yen
Thousands of
U.S. dollars
2013 2012 2013
Book value Book value Book value
Unlisted equity securities ................................................................................. ¥1,010 ¥ 560 $10,739
Investments in unconsolidated subsidiaries and affi liated companies ..................... 3,306 2,819 35,152
Above are not included in ‘(3)(ii) Other securities’ because there is no market value and it is diffi cult to measure the fair value.
(iii) Redemption schedule for money claims and securities with maturity dates subsequent to the consolidated balance sheet date
Millions of yen Thousands of U.S. dollars
2013 2012 2013
Within one year
More than one
year, within fi ve
years Within one year
More than one
year, within fi ve
years Within one year
More than one
year, within fi ve
years
Cash on hand and in banks .............................................. ¥ 93,413
¥— ¥ 90,640 ¥ — $ 993,227 $ —
Notes and accounts receivable–trade ................................ 194,038 — 174,193 — 2,063,137 —
Short-term investment securities and investment securities
Held-to-maturity securities ............................................. — 10 — 10 — 106
Other securities
(1) Bonds ..................................................................... 9,001 — 7,593 — 95,704 —
(2) Other ...................................................................... 111,500 — 133,700 — 1,185,540 —
Total .............................................................................. ¥407,952
¥10 ¥406,126 ¥10 $4,337,608 $106
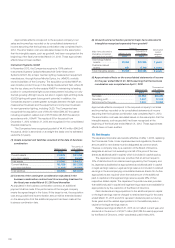
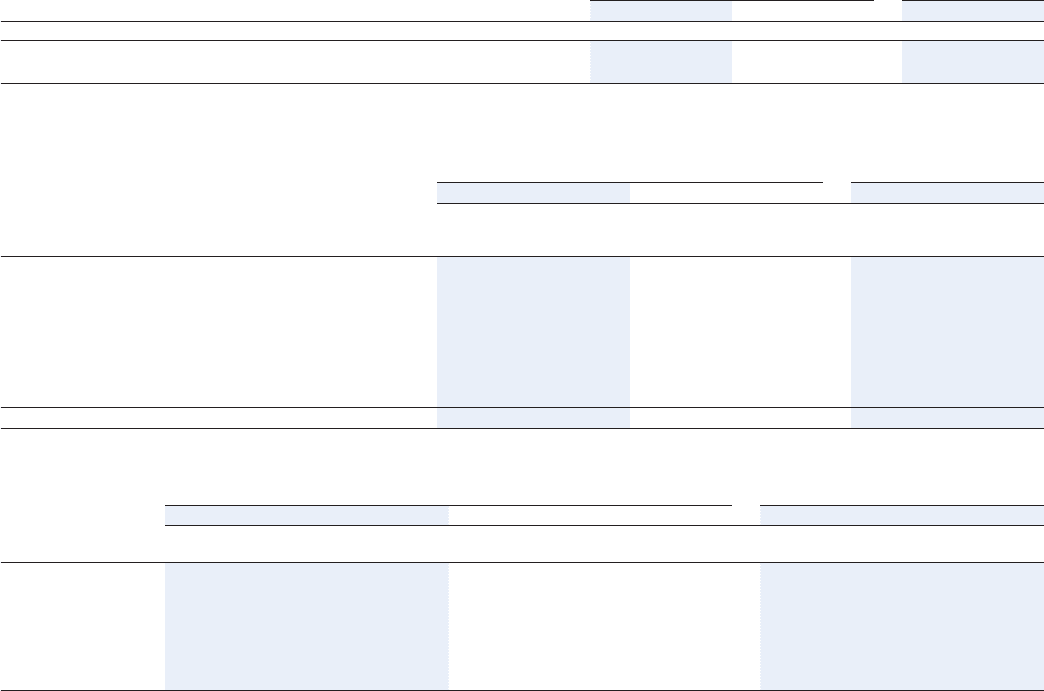
(iv) Redemption schedule for bonds, long-term debt and other debt subsequent to the consolidated balance sheet date
Millions of yen Thousands of U.S. dollars
2013 2012 2013
Fiscal year
Short-term
debt Bonds
Long-term
debt Total
Short-term
debt Bonds
Long-term
debt Total
Short-term
debt Bonds
Long-term
debt Total
2013 ....................... ¥67,398 ¥ — ¥23,990 ¥91,389 ¥32,913 ¥ — ¥11,994 ¥44,907 $716,619 $ — $255,077 $971,707
2014 ....................... — — 27,004 27,004 — — 23,021 23,021 — — 287,124 287,124
2015 ....................... — 20,000 5,000 25,000 — — 27,001 27,001 —212,653 53,163 265,816
2016 ....................... — 20,000 4,000 24,000 — 20,000 5,000 25,000 —212,653 42,531 255,183
2017 ....................... — 10,000 9,000 19,000 — 60,000 4,000 64,000 —106,326 95,694 202,020
2018 and thereafter .. — 20,000 18,501 38,501 — 30,000 14,001 44,001 — 212,653 196,715 409,367