Konica Minolta 2013 Annual Report Download - page 21
Download and view the complete annual report
Please find page 21 of the 2013 Konica Minolta annual report below. You can navigate through the pages in the report by either clicking on the pages listed below, or by using the keyword search tool below to find specific information within the annual report.-
 1
1 -
2
-
3
-
4
-
5
-
6
-
7
-
8
-
9
-
10
-
 11
11 -
 12
12 -
 13
13 -
 14
14 -
 15
15 -
 16
16 -
 17
17 -
 18
18 -
 19
19 -
 20
20 -
 21
21 -
 22
22 -
 23
23 -
 24
24 -
 25
25 -
 26
26 -
 27
27 -
 28
28 -
 29
29 -
 30
30 -
 31
31 -
32
-
33
-
34
-
35
-
36
-
37
-
38
-
39
-
40
-
41
-
42
-
43
-
44
-
45
-
46
-
47
-
48
-
49
-
50
-
51
-
52
-
53
-
54
-
55
 |
 |

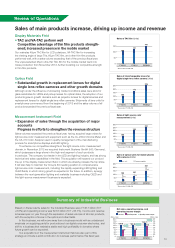
Business Technologies Business, and investment to increase production capacity in
the Optics Business. Depreciation decreased ¥3.3 billion, or 6.6%, year on year to
¥45.9 billion.
Research and Development Costs
Research and development (R&D) costs decreased ¥0.9 billion, or 1.4%, year on year
to ¥71.5 billion despite continued investment in future growth areas. By business
segment, R&D costs were ¥39.3 billion, down 10.9% year on year, in the Business
Technologies Business, ¥14.6 billion in the Industrial Business, and ¥2.8 billion, down
41.9% year on year, in the Healthcare Business. Basic research costs that were not
included in the business units were ¥14.6 billion, up 11.4% year on year.
Financial Position
Assets
Current assets in the form of cash and cash equivalents at March 31, 2013 decreased
¥18.0 billion from a year earlier to ¥213.9 billion. Cash on hand and in banks increased
¥2.7 billion to ¥93.4 billion, short-term investment securities decreased ¥20.7 billion to
¥120.5 billion. Notes and accounts receivable – trade increased ¥19.8 billion to
¥194.0 billion. Inventories increased ¥7.3 billion to ¥112.4 billion.
Property, plant and equipment as of March 31, 2013 decreased ¥0.9 billion from a
year earlier to ¥179.9 billion due to depreciation and capital expenditure in the Business
Technologies Business. Intangible assets increased ¥23.5 billion from a year earlier to
¥110.9 billion due to increased goodwill as a result of business acquisitions in the
Business Technologies Business and the Industrial Business. Investments and other
assets as of March 31, 2013 increased ¥0.3 billion from a year earlier to ¥70.1 billion.
As a result of these factors, total assets at March 31, 2013 increased ¥38.5
billion, or 4.3%, from a year earlier to ¥940.5 billion.
Liabilities
Notes and accounts payable – trade decreased ¥2.7 billion to ¥85.4 billion while
interest-bearing debt (total of short-term and long-term debt and bonds) decreased
¥3.0 billion to ¥224.8 billion. However, total liabilities as of March 31, 2013 were
¥474.1 billion due to an increase in accrued expenses and accounts payables.
Net Assets
Accumulated other comprehensive income recorded an increase of ¥2.1 billion in
unrealized gains on securities due to the effects of the stock market and an increase
of ¥21.9 billion in foreign currency translation adjustments as a result of changes in
foreign currency translation adjustments associated with the correction of the strong
yen, mainly the U.S. dollar and the euro.
As a result of the above, net assets at March 31, 2013 increased ¥31.4 billion, or
7.2%, from a year earlier to ¥466.4 billion.
At March 31, 2013, the equity ratio increased 1.4% percentage points from a year
earlier to 49.4%.
Dividend Policy
Basic Dividend Policy
The Company considers distribution of earnings to shareholders a management
priority under a basic policy of sustained distribution of earnings to shareholders after
comprehensive consideration of factors including consolidated business results and
strategic investment in growth areas. The Company’s specifi c medium-to-long-term
財務分析
(Billions
of yen)
192.5
227.9
231.9
224.8
213.9
Interest-bearing debt
Cash and short-term investment
securities
FY2011FY2010 FY2012
300
50
100
150
200
0
250
(%)
171.5
171.5
Net debt-equity ratio
0.10
0.00
0.02
0.06
-0.02
0.08
0.04
0.040.04 -0.01
-0.01
0.02
0.02
Cash dividends per share
and consolidated payout ratio
25
5
10
15
20
0
30
50
10
20
30
40
0
60
(Yen) (%)
30.7% 38.9%
52.6%
FY2011FY2010 FY2012
15.0 15.0 15.0
Net assets
428.9 434.9
0
466.4
FY2011FY2010 FY2012
(Billions of yen)
500
100
200
300
400
Management’s Discussion and Analysis
20